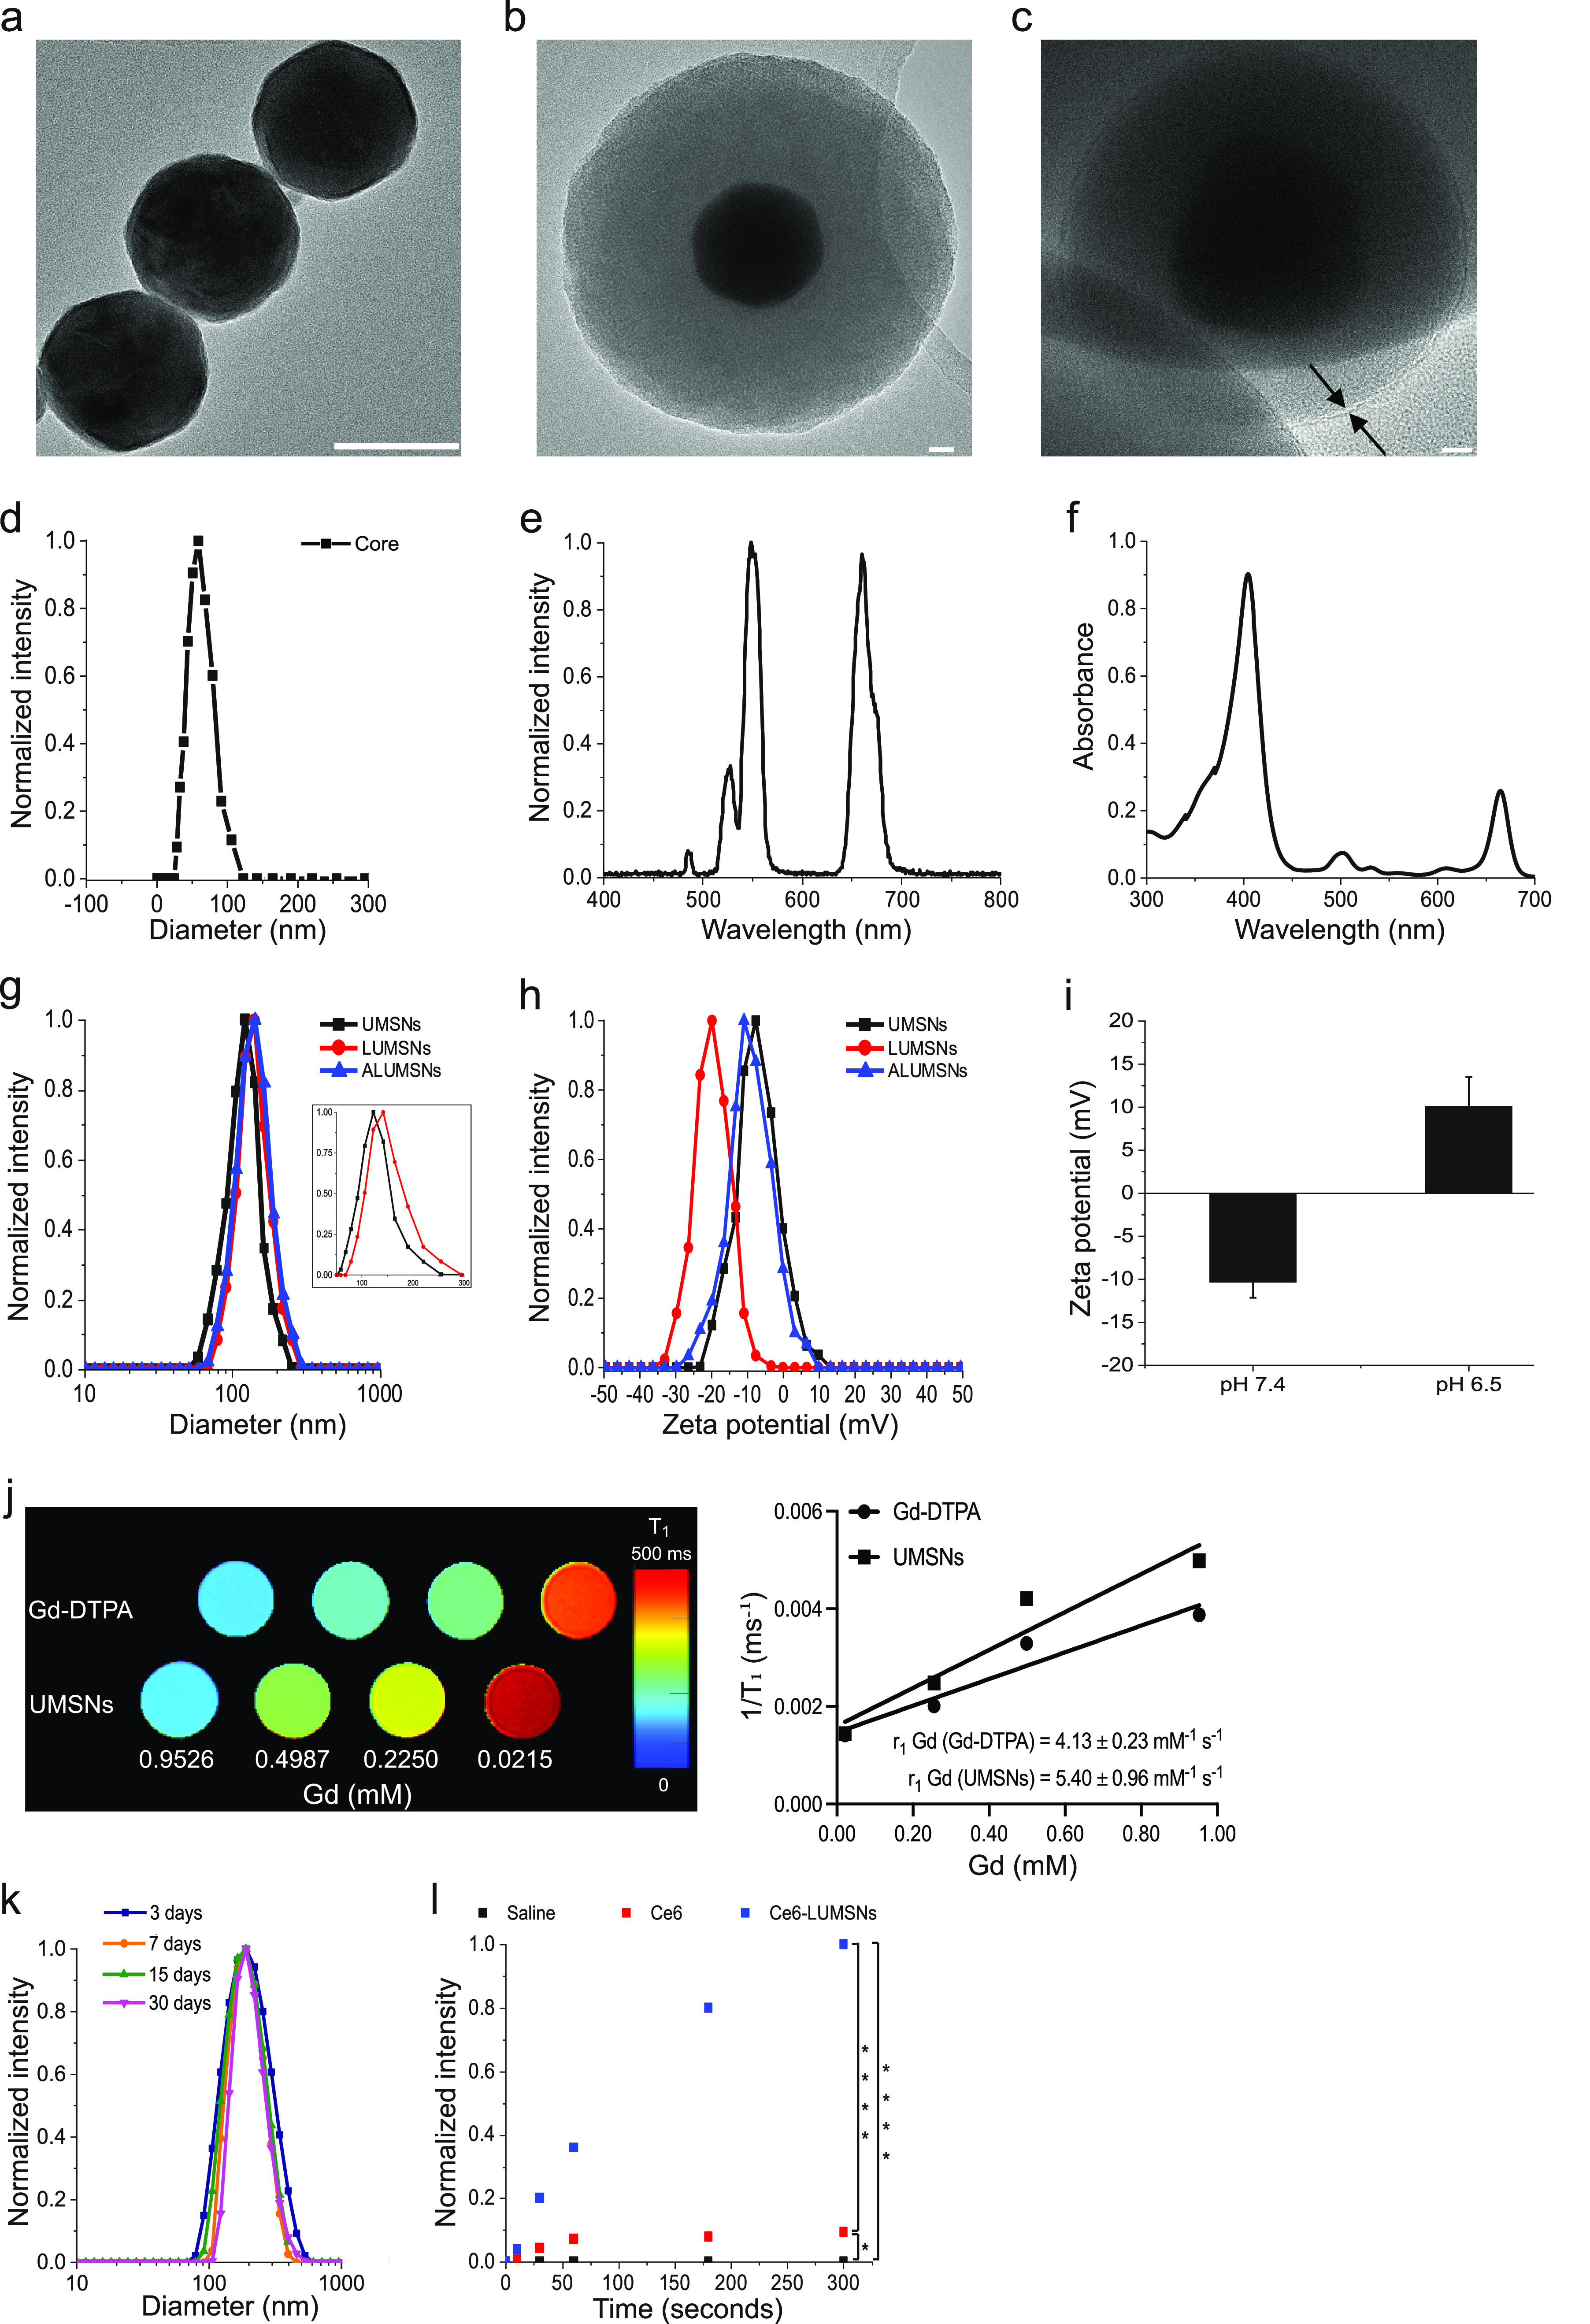
Figure 2.

Characterization of the upconversion mesoporous silica nanospheres. (a–c) Transmission electron microscopy (TEM) images of the upconversion core (NaYF4:Yb/Er/Gd,Bi2Se3) (a), upconversion mesoporous silica nanospheres (UMSNs) (b), and lipid/PEG-coated UMSNs (LUMSNs) (c). The arrows in (c) indicate the lipid bilayer. Scale bar in (a) = 50 nm, in (b) and (c) = 10 nm. (d) Size analysis for the upconversion core in 10 mM phosphate buffer (pH 7.4) using dynamic light scattering (DLS). (e) Fluorescence emission spectrum of the upconversion core (λex = 980 nm). (f) UV–vis absorption spectrum of chlorin e6 (Ce6) (Soret peak at 404 nm and Q-band at 658 nm).33 (g,h) Size distribution analysis (g) and zeta potential measurements (h) for UMSNs, LUMSNs, and ALUMSNs in 10 mM phosphate buffer (pH 7.4). Inset: expanded scale to show difference in hydrodynamic diameters of UMSNs and LUMSNs. (i) Comparison of zeta potentials of ATRAM-functionalized LUMSNs (ALUMSNs) at pH 7.4 and 6.5. (j) T1 maps (left) and the relaxation rates (1/T1) (right) of UMSNs compared to commercial Gd-DTPA (at the same concentrations of the lanthanide) (n = 3). (k) Colloidal stability analysis for LUMSNs in complete cell culture medium (RPMI 1640 containing 10% FBS, pH 7.4) over 30 days at 37 °C. (l) Comparison of ROS production capability of Ce6-LUMSNs and free Ce6, at the same Ce6 concentration (0.5 μg/mL) and NIR laser irradiation power density and duration (1.0 W/cm2, 5 min), monitored in 10 mM phosphate buffer (pH 7.4) using the fluorescent probe Singlet Oxygen Sensor Green (SOSG).58 *P < 0.05, ****P < 0.001 for comparisons with controls or among the different samples.
