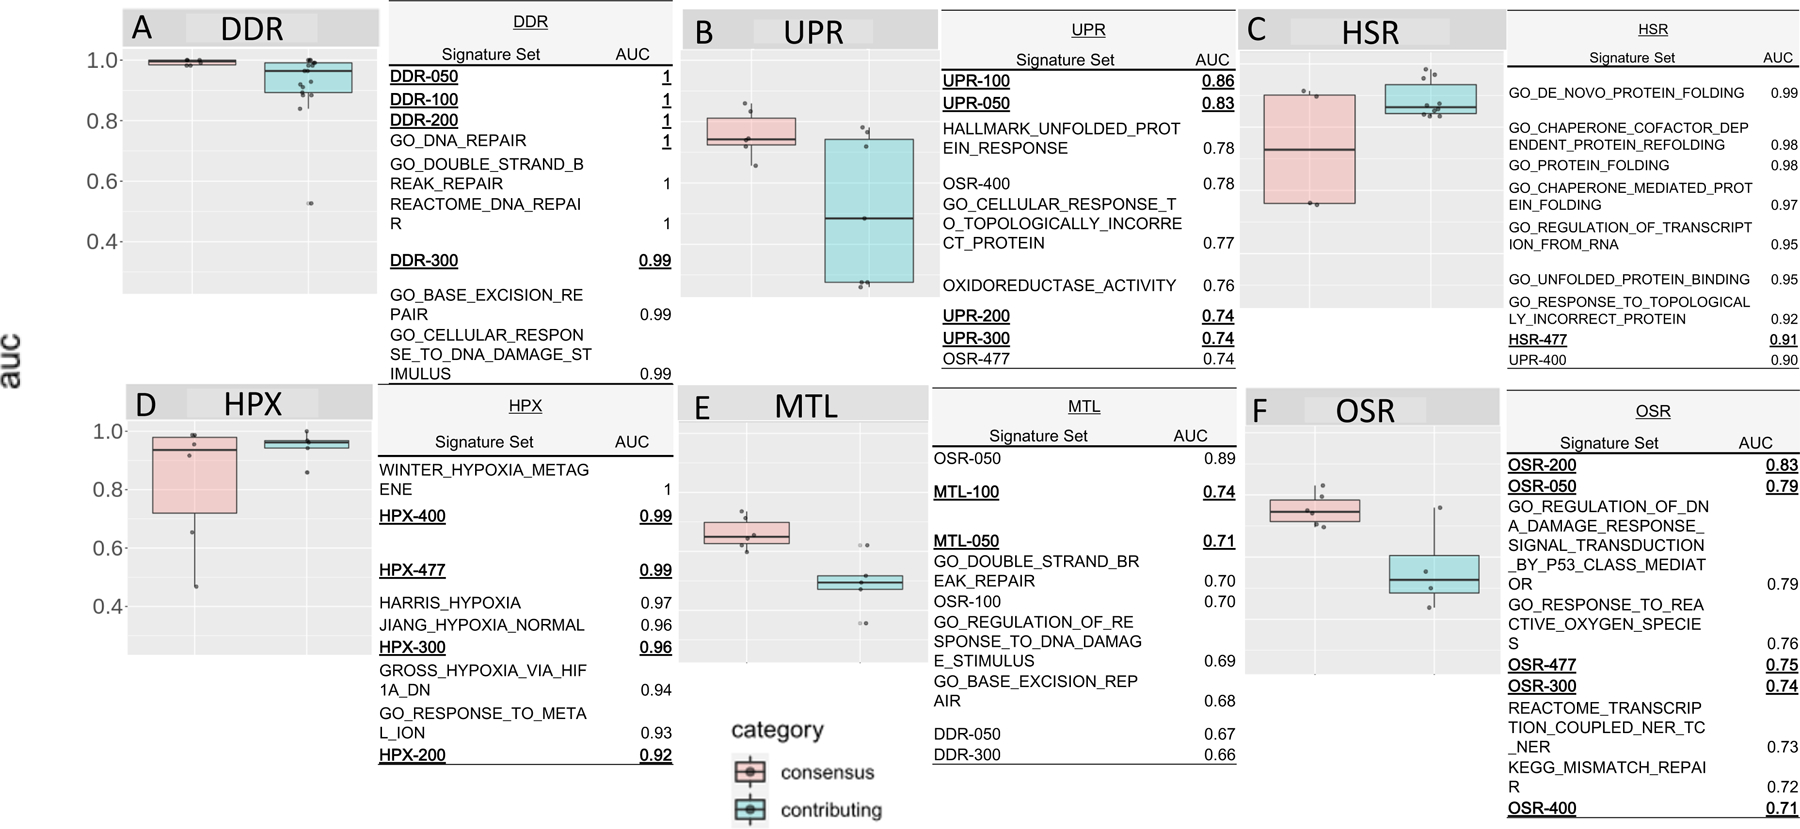
Figure 2.

Area under receiver operator characteristic curve for consensus and contributing published signature sets for each canonical stress response pathway (A-F). The receiver operator characteristic was calculated as sensitivity vs. specificity. The top nine signatures for each stress system are listed in tables next to each boxplot. Consensus signatures are shown in bold and consensus signatures relevant to the identified stress response pathway are underlined.
