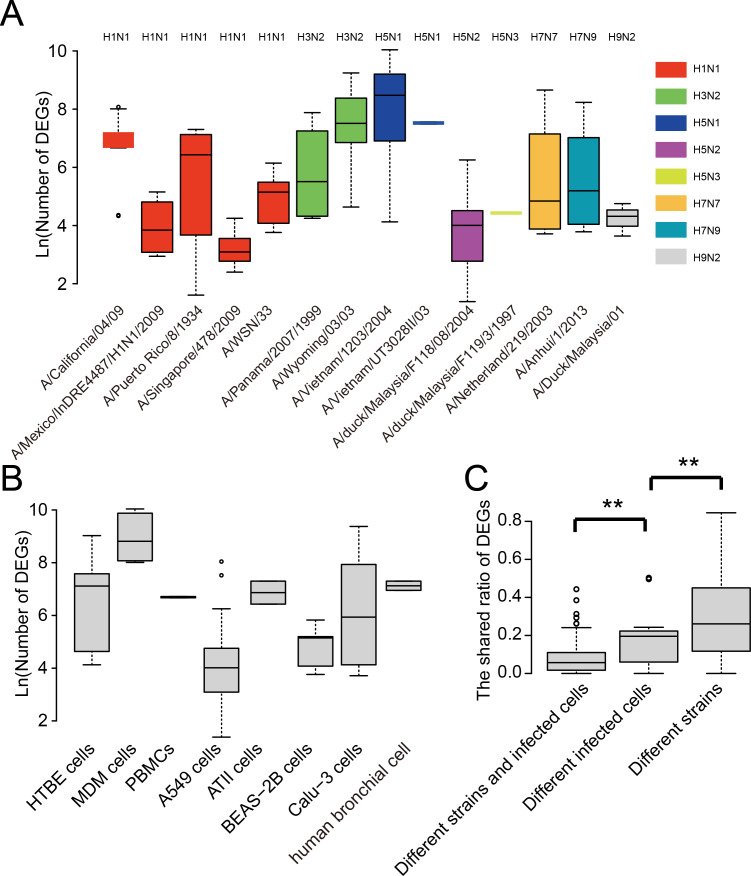
Figure 3. Analysis of the strain and cell specificity in DEGs.
(A) Number of DEGs in different influenza virus strains. (B) Number of DEGs in different cell types infected by influenza viruses. (C) The shared ratio of DEGs between different strains and cell types. Asterisks (**) indicate p-value < 0.01.

