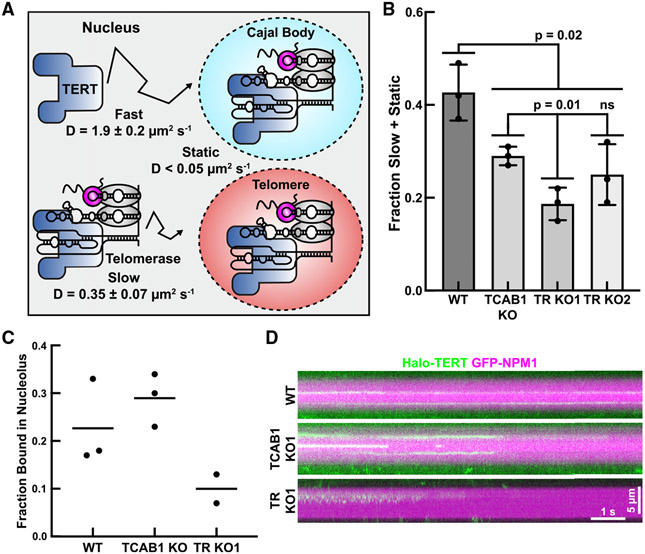
Figure 4. Telomerase assembly is reduced in live TCAB1 knockout cells.
(A) Diagramof distinct populations of TERT particles detected in control cells (three replicates of >15 cells, mean ± SD).
(B) Fraction of slow plus static 3xFLAG-HaloTag-TERT particles in control, TCAB1 knockout, and TR knockout cells (three replicates of >15 cells, mean ± SD, t test).
(C) Quantification of the fraction of TERT particles statically bound to the nucleolus in control (WT), TCAB1 knockout, and TR knockout cells (two or three replicates of >18 cells, mean).
(D) Kymographs of HaloTag-TERT particles that co-localized with nucleoli (GFP-NPM1) in control (WT), TCAB1 knockout, and TR knockout cells.

