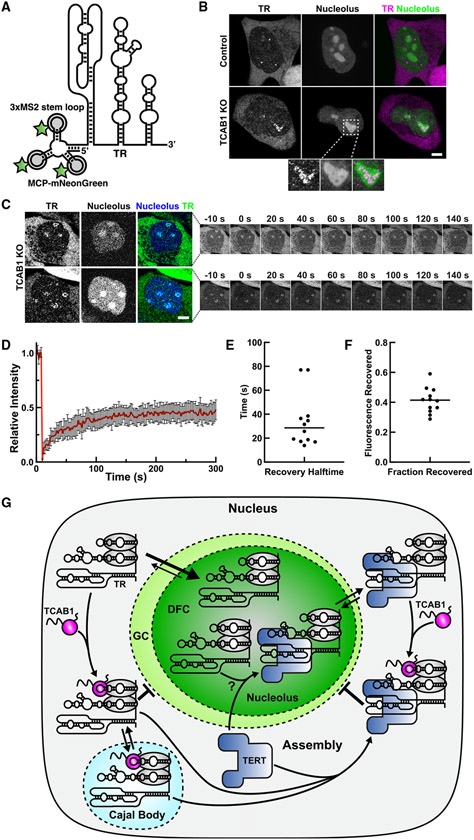
Figure 7. Analysis of the nucleolar binding dynamics of dyskerin and TR.
(A) Model of 3xMS2-TR bound to MCP-mNeon-Green.
(B) Live-cell microscopy images of control and TCAB1 knockout cells expressing 3xMS2-TR, MCP-mNeonGreen, and BFP-NLS to mark the nucleolus (scale bar, 5 μm).
(C) FRAP of 3xMS2-TR within the DFC of the nucleolus marked by BFP-NLS (scale bar, 5 μm).
(D) FRAP of MS2-TR within nucleoli of TCAB1 knockout cells (n = 12 cells, mean and 95% confidence interval).
(E) Quantification of the recovery half-time from single-exponential fits of individual recovery curves (n = 12, mean).
(F) Quantification of the fraction of fluorescence recovered from single-exponential fits of individual recovery curves (n = 12 cells, mean).
(G) Model for TCAB1-mediated retention of TR in the nucleoplasm which facilitates TR assembly with TERT.

