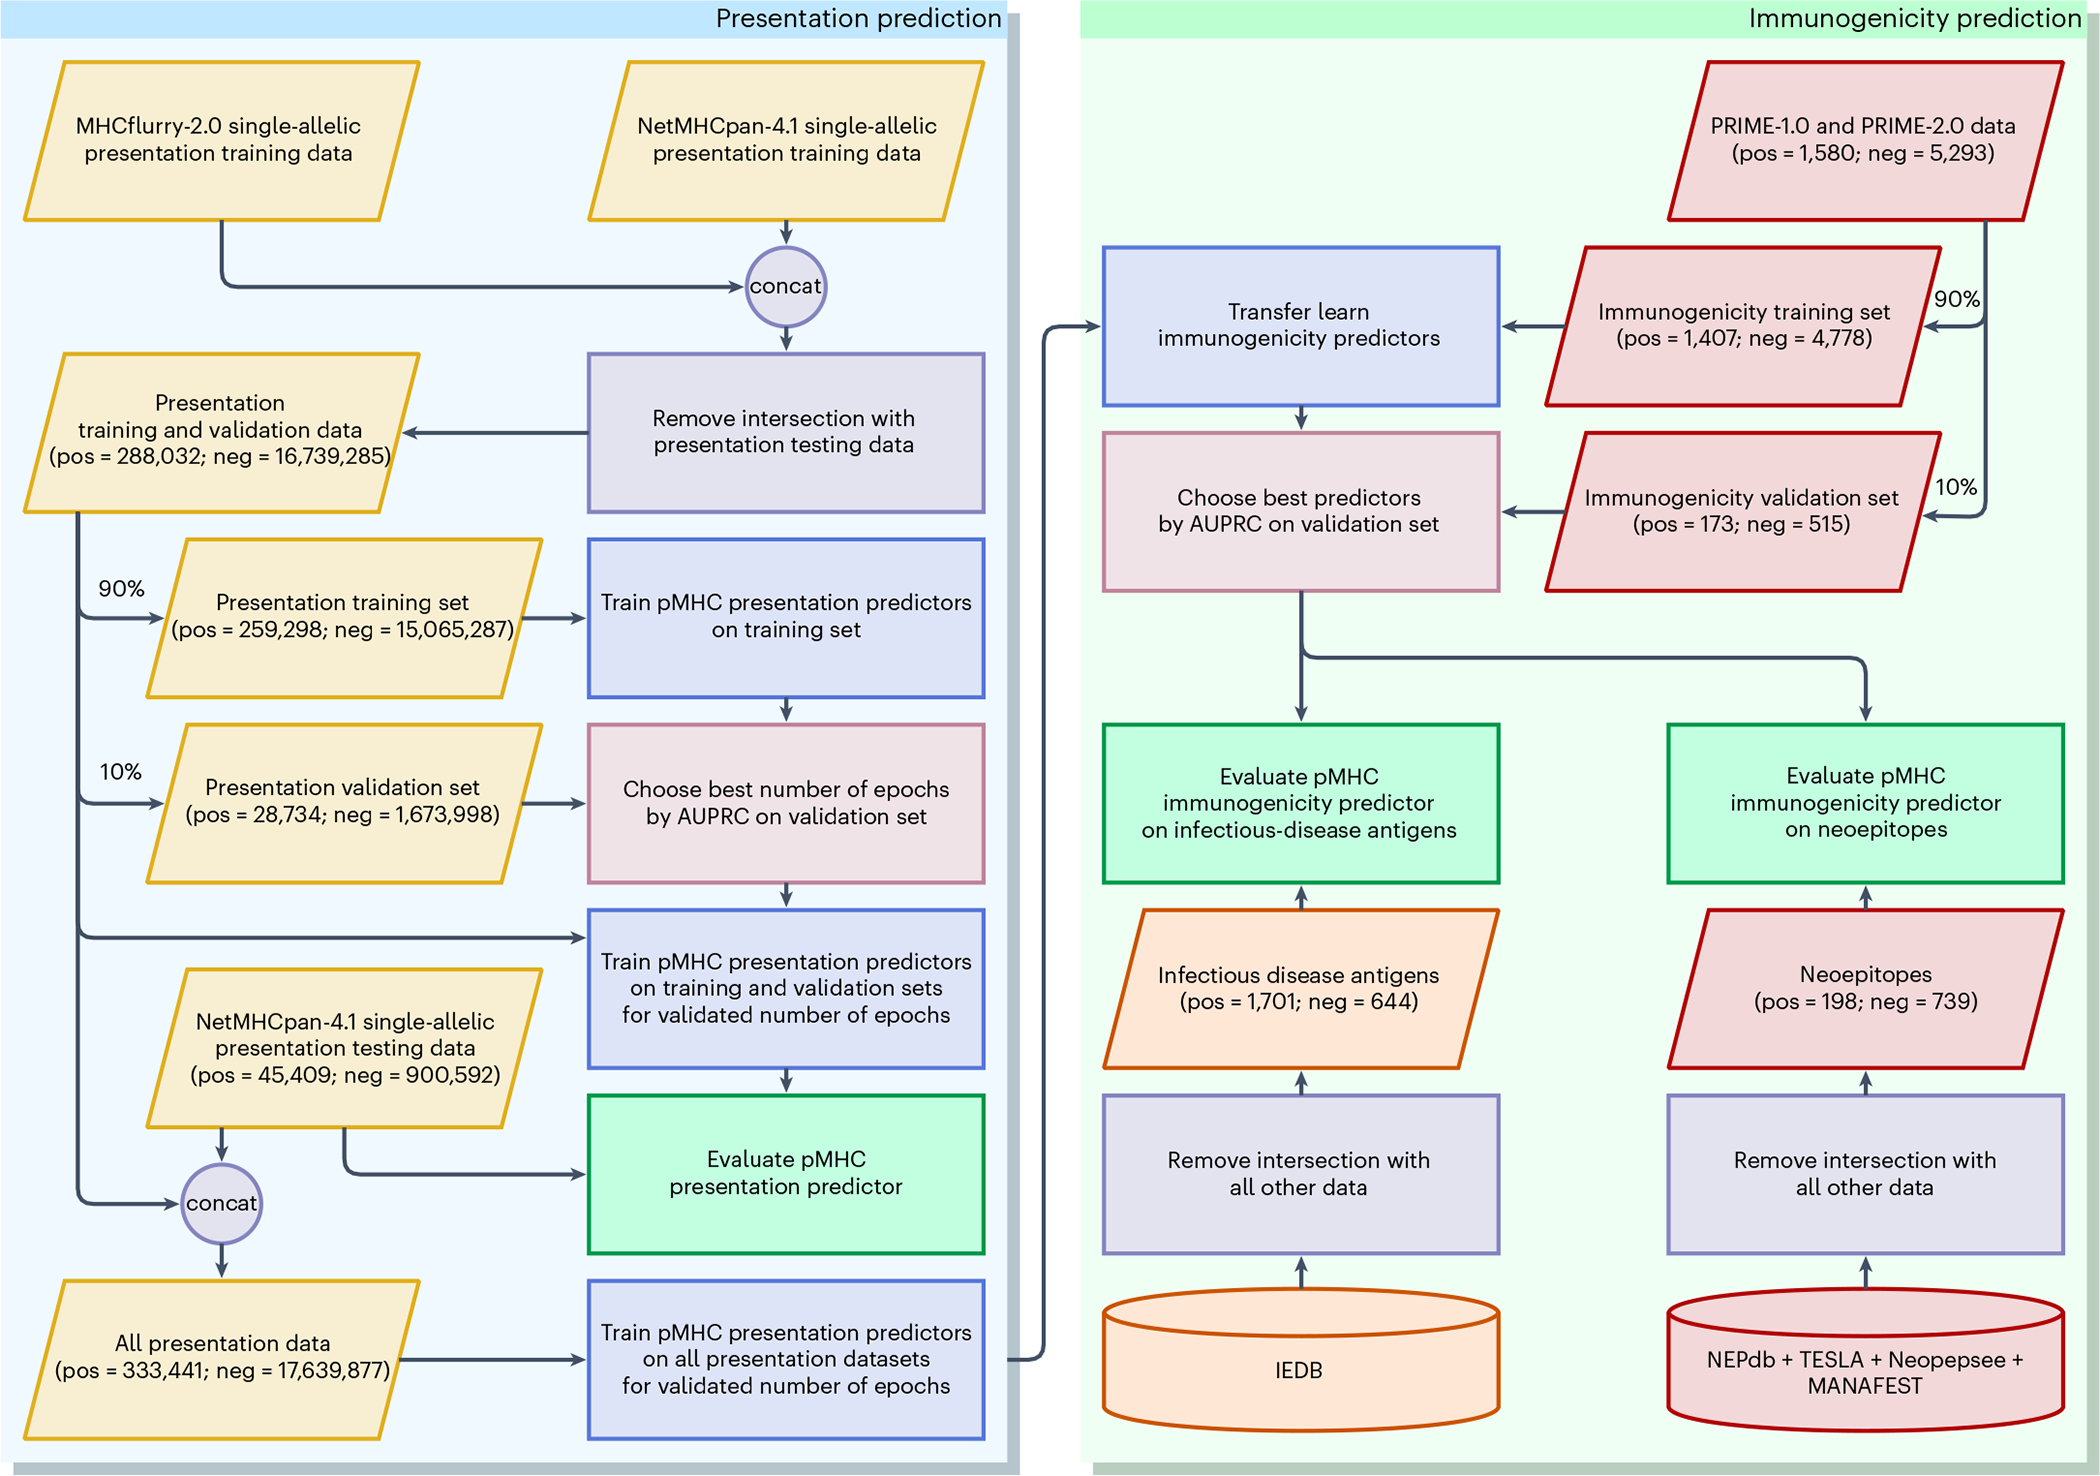
Fig. 1 |. Experimental procedure.

The procedure includes presentation training, immunogenicity transfer learning and independent evaluation on multiple datasets. The circles labelled ‘Con’ indicate dataset concatenation. Input and database symbols are color-coded by data type: presentation (yellow), immunogenicity training and neoepitope evaluation data (red), and infectious disease (orange). Rectangles are the processes: removing data overlap (purple), choosing best models (pink), training (blue), and evaluation (green).
