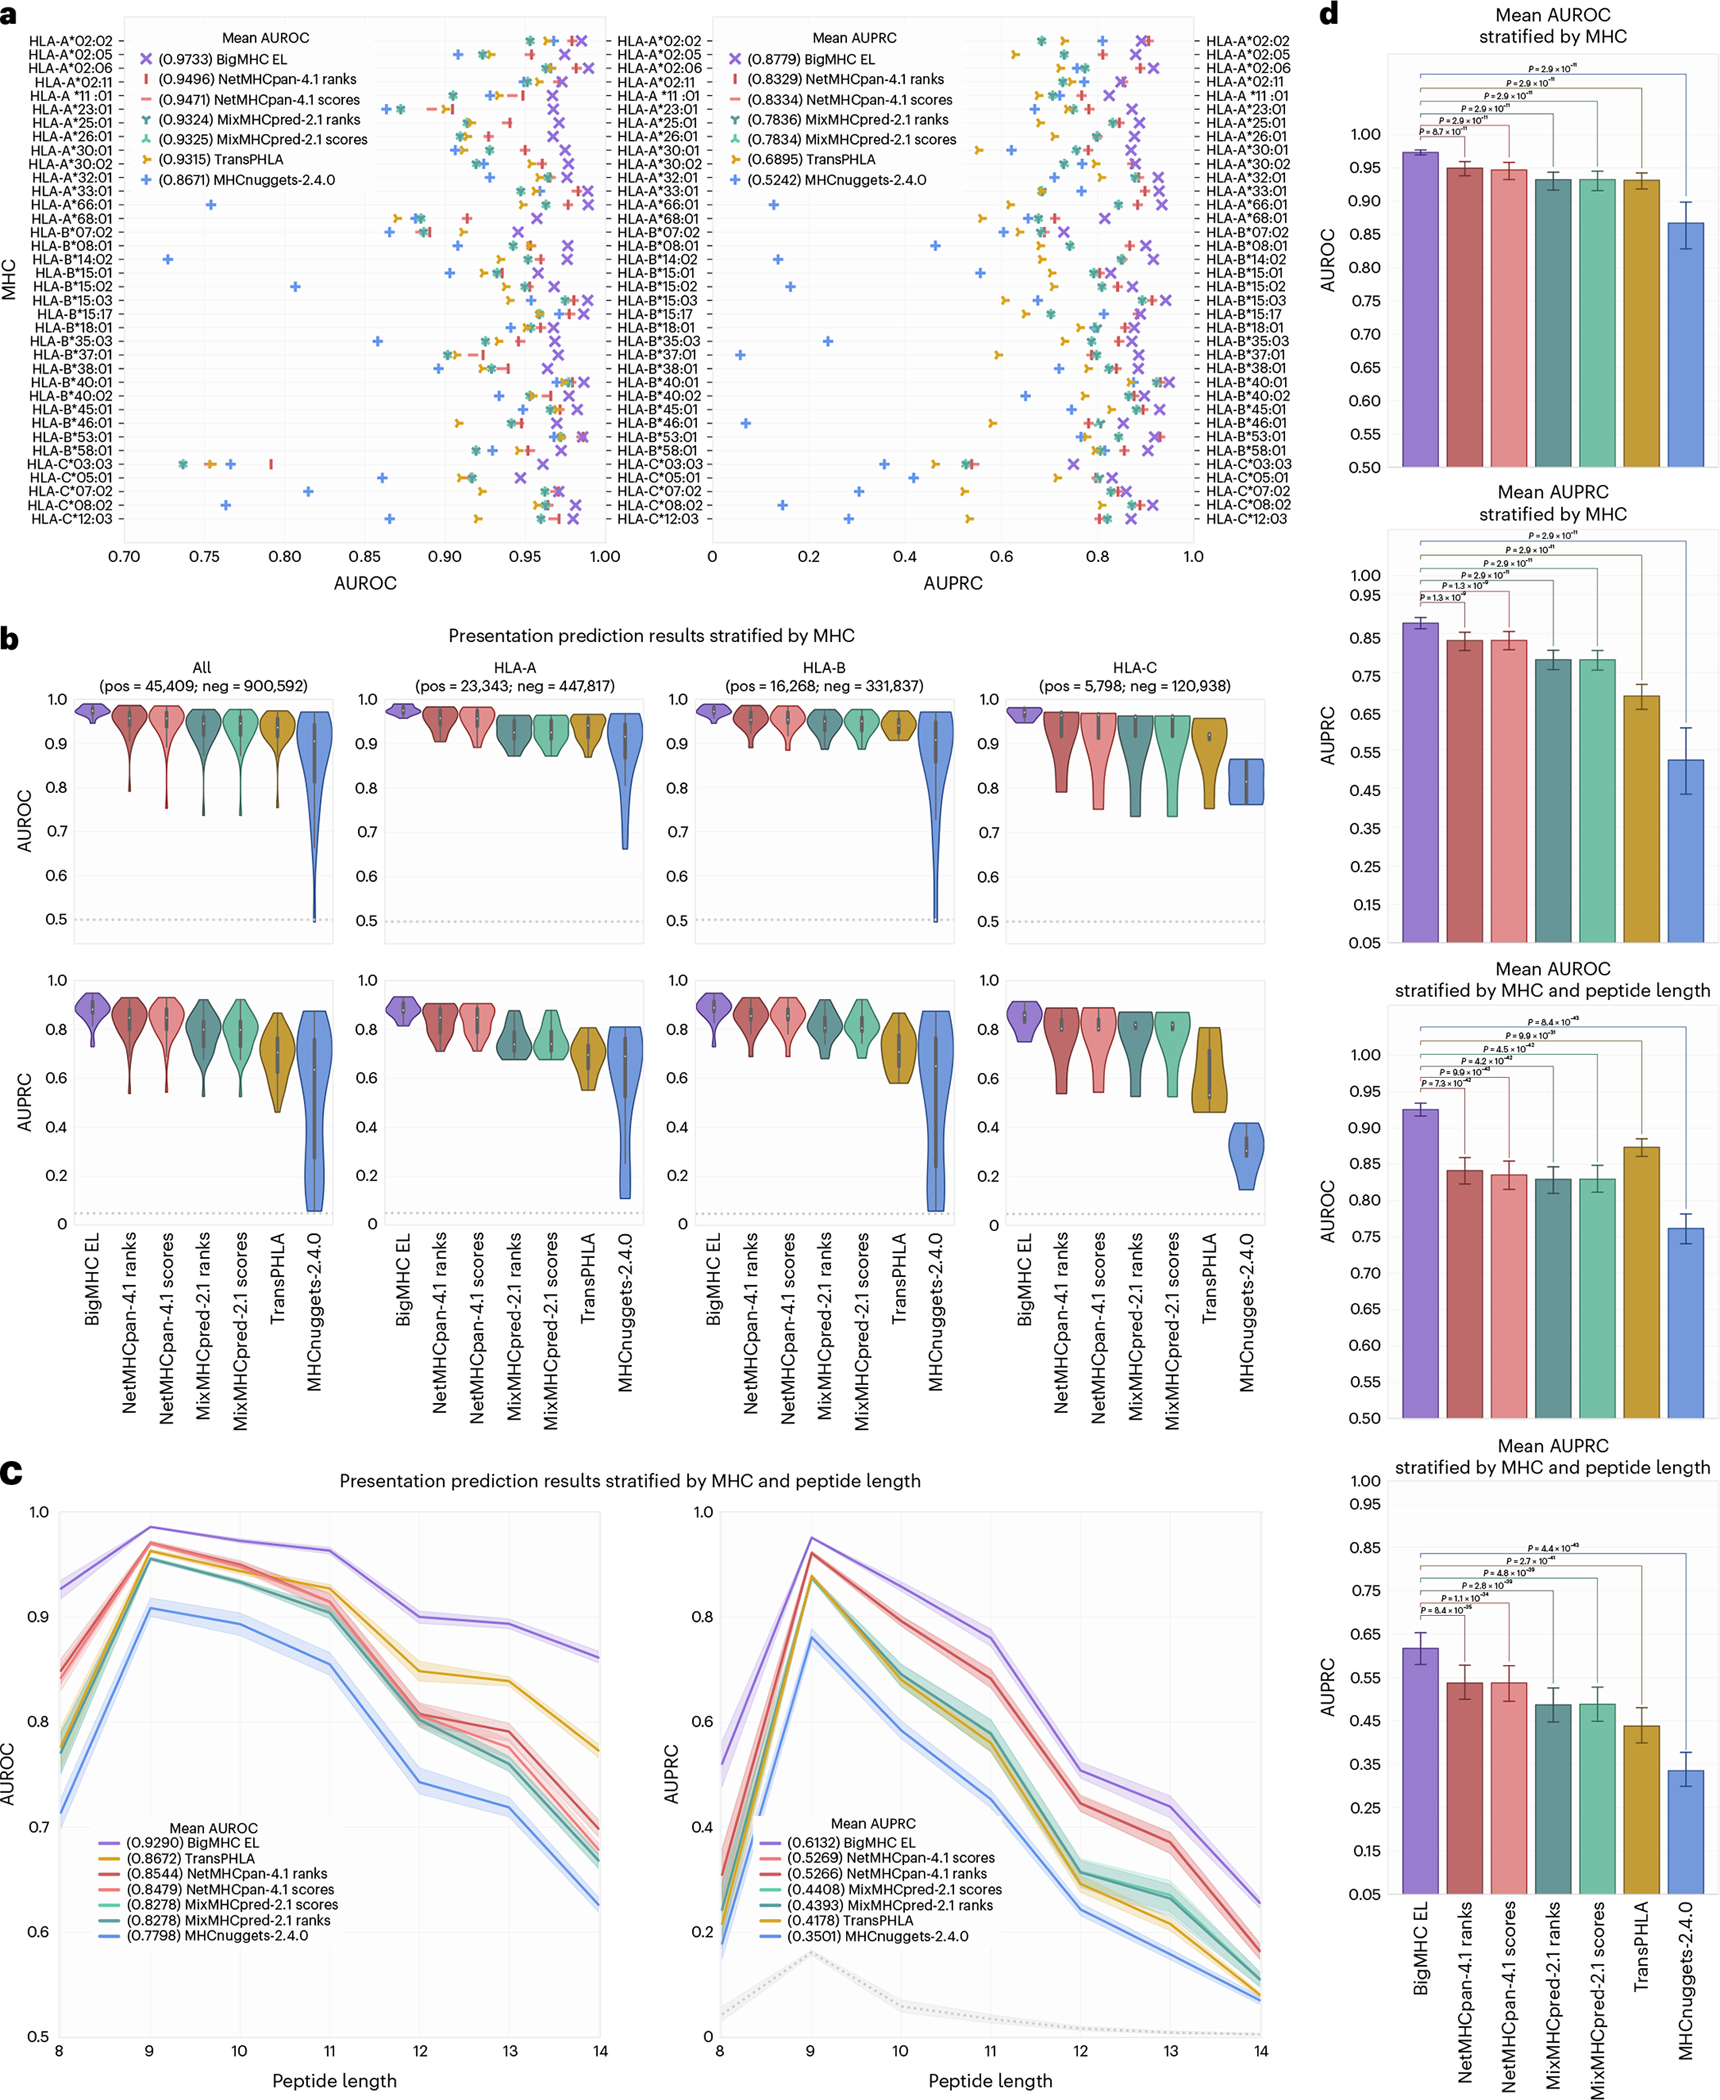
Fig. 3 |. EL prediction results.

a, AUROC and AUPRC for each allele in the EL testing dataset. b, AUROC and AUPRC violin plots with embedded box-and-whisker plots stratified by allele and grouped by MHC locus. c, Mean AUROC and AUPRC per peptide allele length with 95% CI by MHC stratification. Baseline (random) classifier performance is 0.5 for AUROC and illustrated in grey for AUPRC. d, Mean AUROC and AUPRC and 95% CI stratified by MHC () and both MHC and epitope length () with two-tailed Wilcoxon signed-rank test adjusted P-values across methods.
