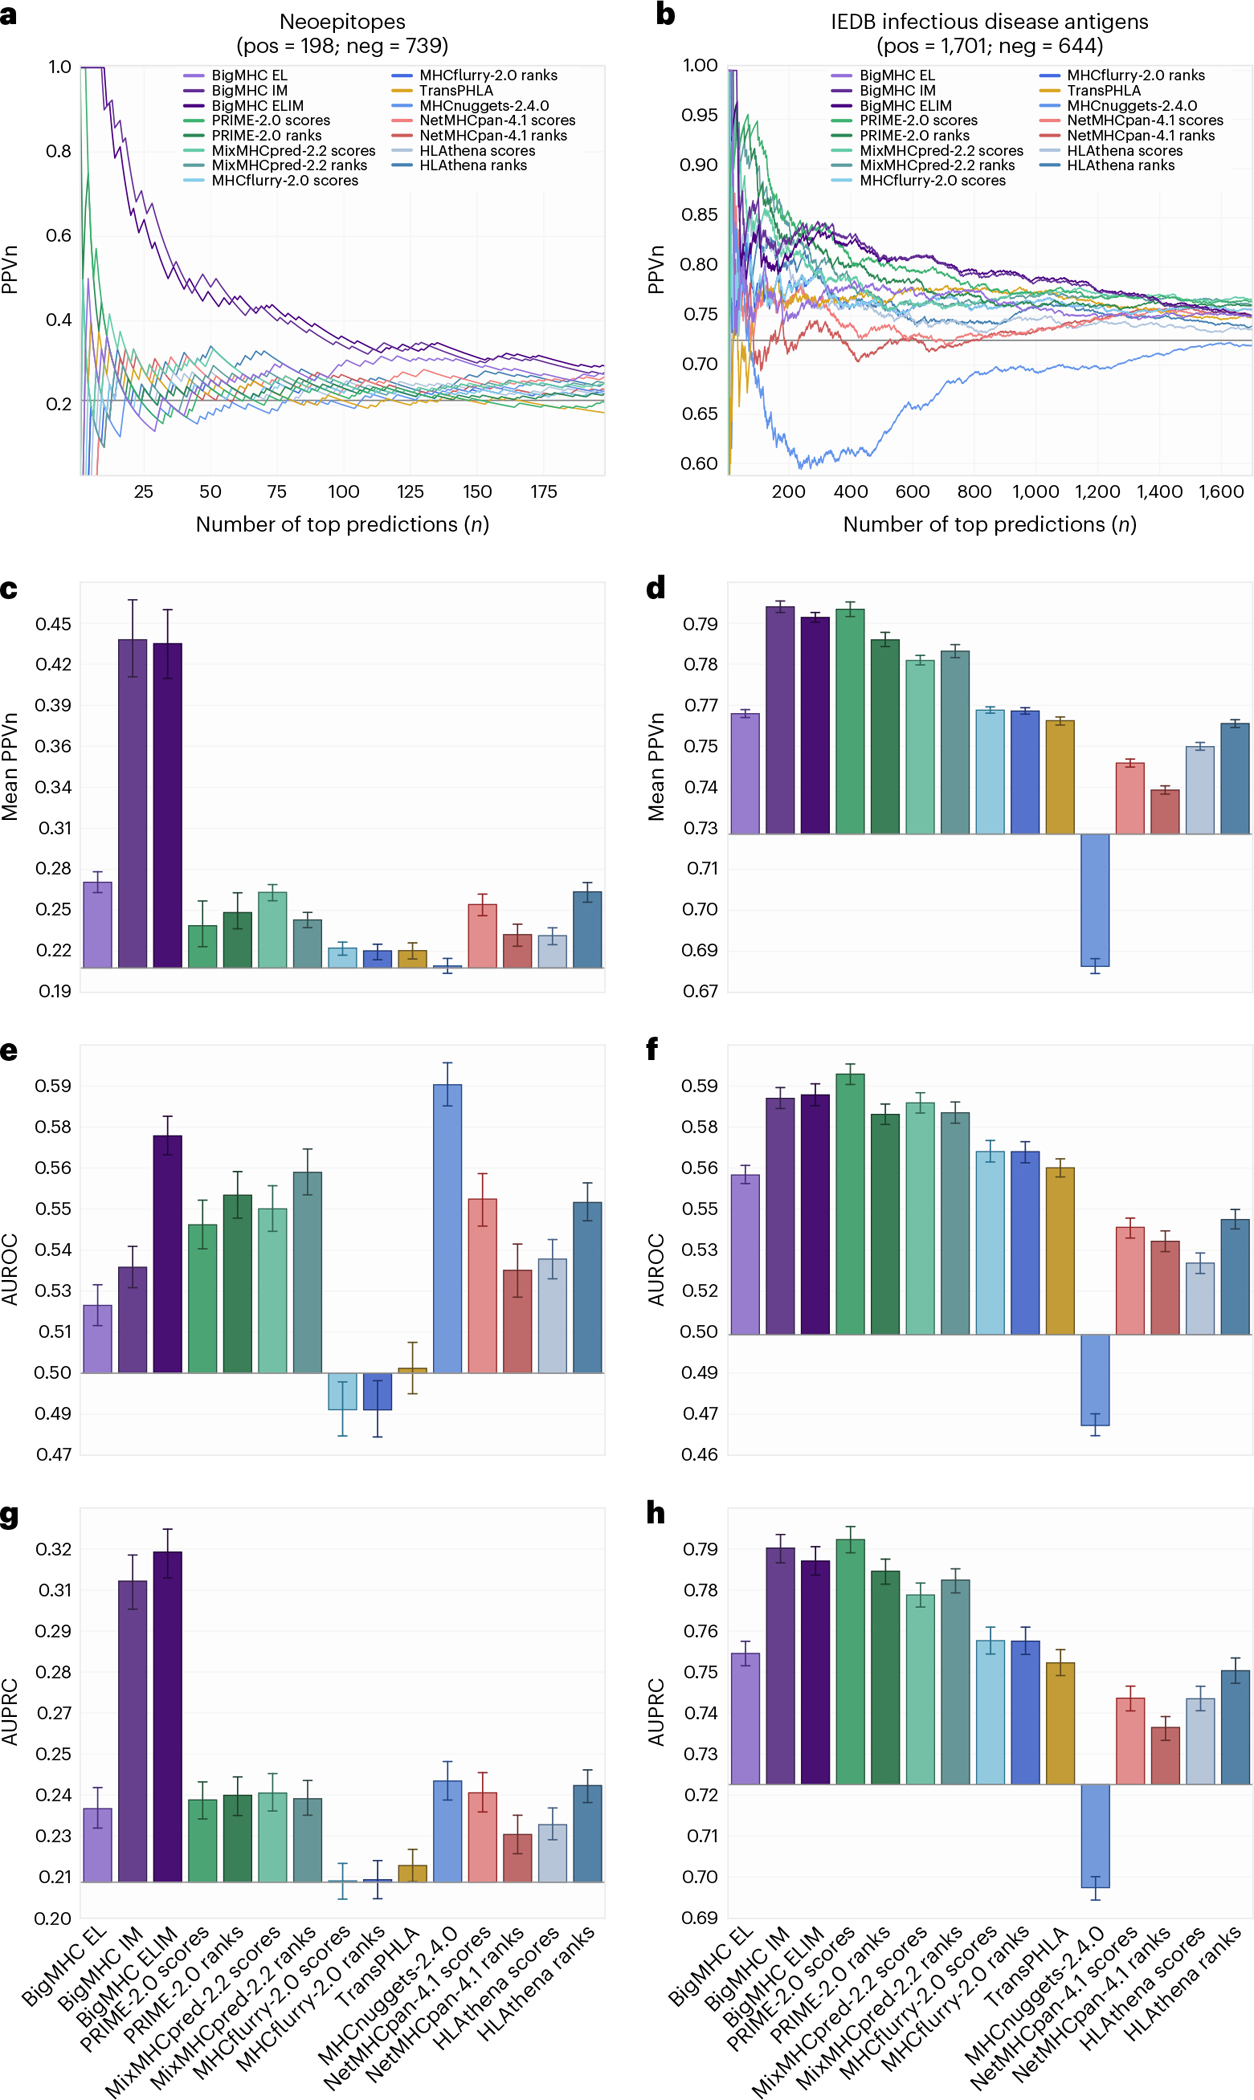
Fig. 4 |. Performance of immunogenicity predictions for all methods.

a,b, PPVn is calculated for each method as the fraction of neoepitopes (a) or infectious disease antigens (b) that are immunogenic within the top n predictions. c,d, The mean PPVn and 95% CI whiskers are reported for neoepitopes (c; ) and infectious disease antigens (d; ), summarizing the PPVn curves for all valid choices of . The baseline PPVn, representing a random classifier, is illustrated as a horizontal line at 0.2113 for neoepitopes and 0.7254 for infectious disease antigens. e–h, Mean AUROC (e,f) and mean AUPRC (g,h) of all methods with 95% bootstrap CIs from iterations for neoepitopes (e,g) and infectious disease antigens (f,h).
