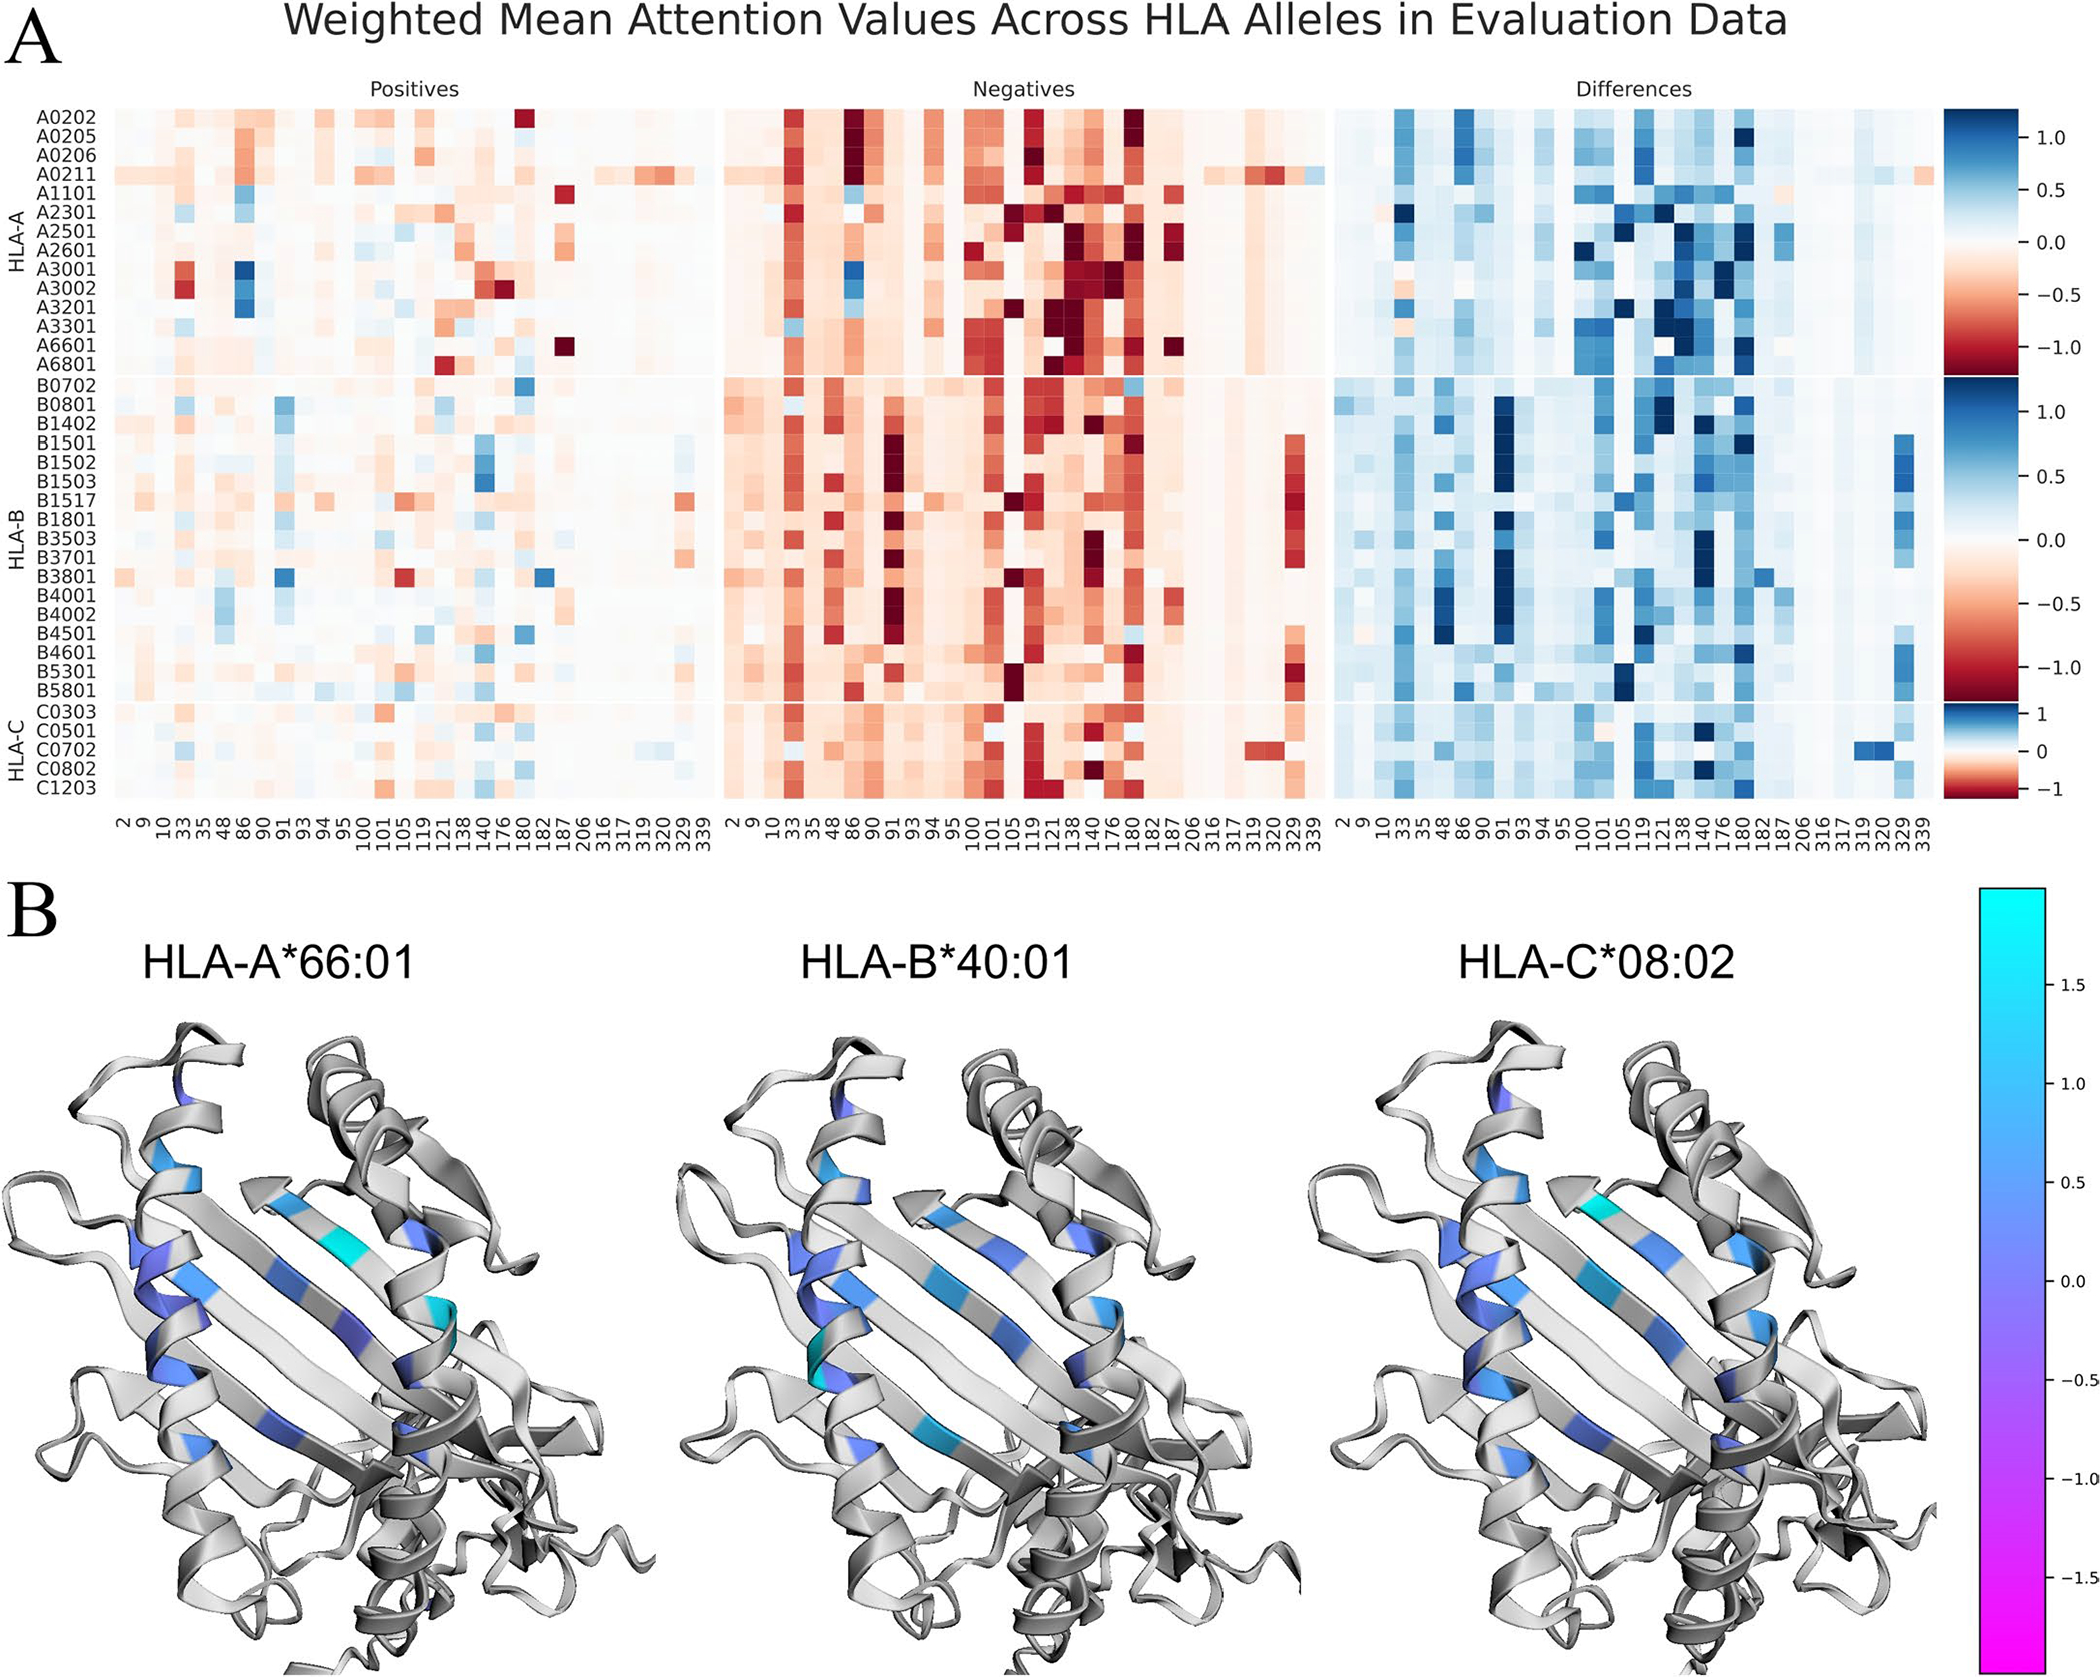
Extended Data Fig. 1 |. Visualization of BigMHC average attention to MHC encodings on the EL test data.

a Heatmap visualization of the average attention value for each position in the MHC pseudosequence on the EL testing dataset. The heatmap is stratified by MHC allele as rows, and separated by positive and negative testing instances. The position of each amino acid in the sequences from IPD-IMGT/HLA is provided at the bottom of each column. Darker values indicate MHC positions that are more influential on the final model output. The column of Differences depicts the Negatives values subtracted from the Positives values; thus, darker blue colours are most correctly discriminative whereas darker red attention values in this column highlight erroneous inferences. b Overlays of the Differences column from the training dataset on the MHC molecule using py3Dmol. MHC protein structure models are generated using AlphaFold.
