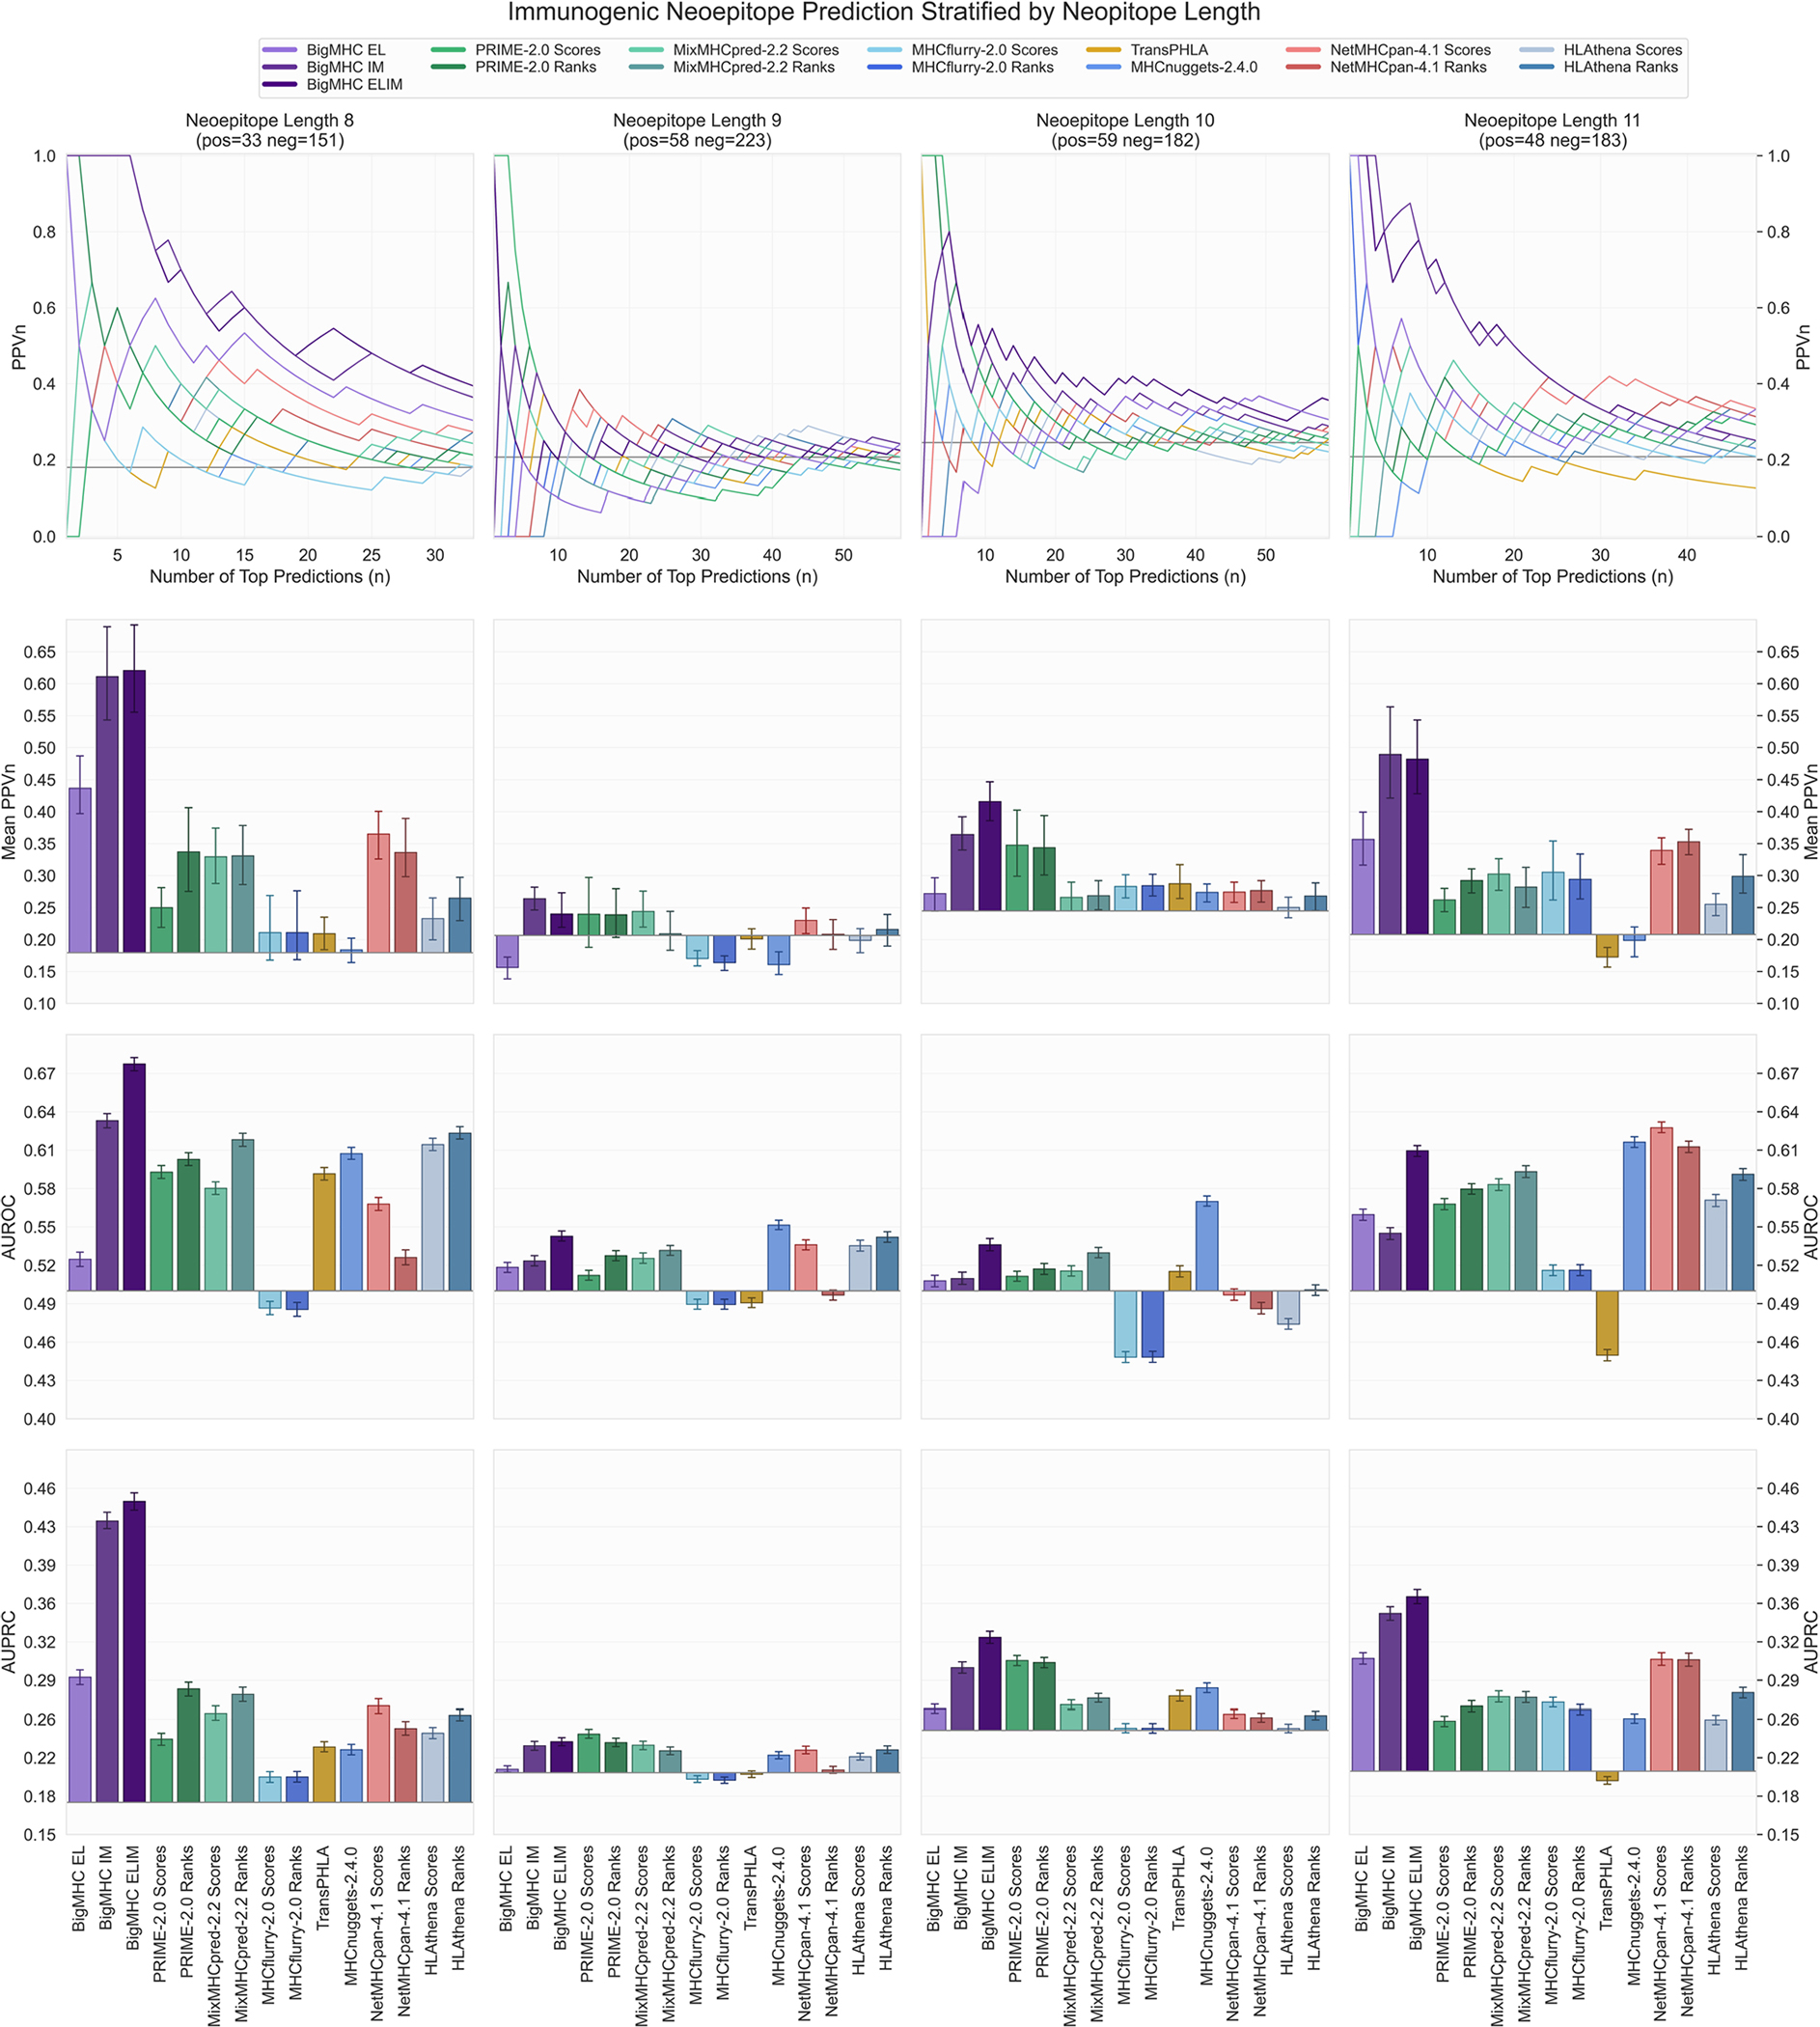
Extended Data Fig. 3 |. Neoepitope immunogenicity prediction results stratified by neoepitope length.

PPVn, mean PPVn, AUROC, and AUPRC are calculated and visualized in the same manner as Fig. 4. Bars represent means and error bars are 95% CIs. Neoepitope prediction performance from Fig. 4 is stratified by neoepitope length: 8 (), 9 (), 10 (), and 11 ().
