
Extended Data Fig. 2 |. In vitro characterization of CNV-Y-DAMGO activity at opioid receptors.
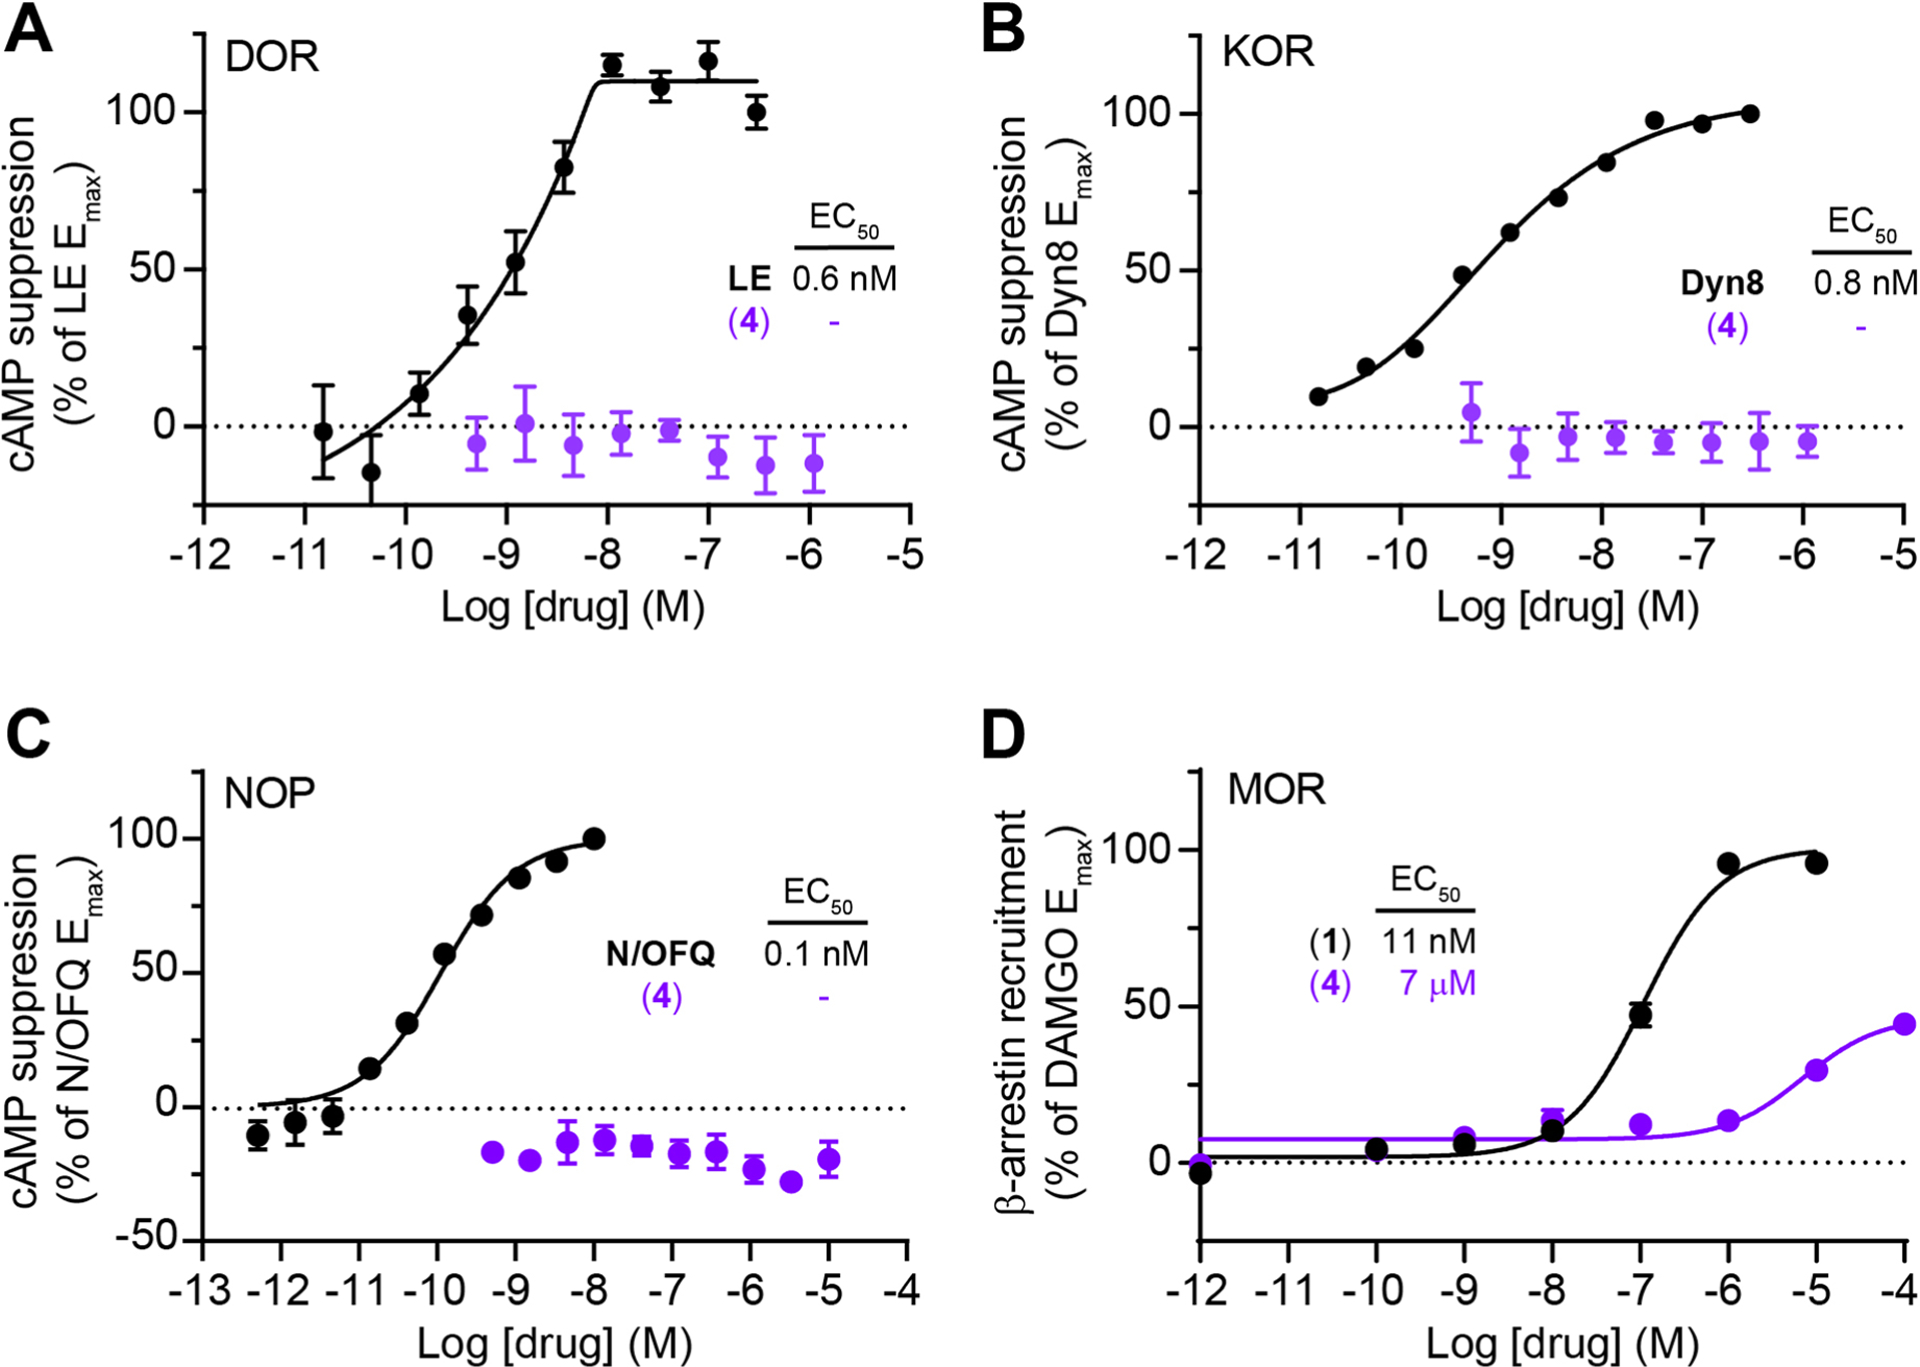
(A) Dose-response curves at the delta opioid receptor (DOR) using a GloSensor assay of cAMP signaling in HEK293T cells (n = 5 wells per data point, 1 representative independent experiment shown). Data were normalized to the maximal response to leucine-enkephalin (LE, 1 μM) and are expressed as the mean ± SEM. (B) Same as A, but using the kappa opioid receptor (KOR) and dynorphin A(1–8) (Dyn8, 1 μM) for normalization. (C) Same as A, but using the nociceptin/orphanin FQ receptor (NOP) and nociception/orphanin FQ (N/OFQ, 1 μM) for normalization. (D) Dose-response curves at the mu opioid receptor (MOR) using a NanoBiT-based luminescence complementation assay of β-arrestin signaling in HEK293T cells (n = 4 wells per data point, 3 independent experiments averaged). Data were normalized to the maximal response to DAMGO (10 μM) and are expressed as the mean ± SEM.