. 2023 Apr 18;66(8 Suppl):3132–3150. doi: 10.1044/2023_JSLHR-22-00263

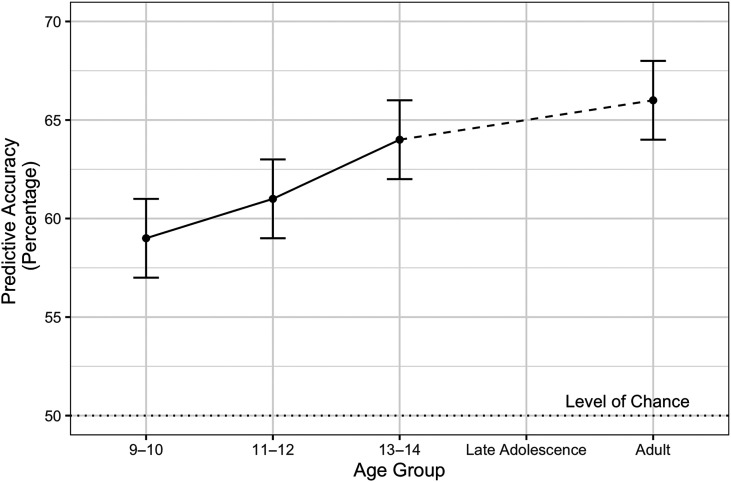
Figure 4.

A plot of the predictive accuracy in percentage versus the age group. Points with error bars are marked on the graph. In the description, each point is represented by a 3 tuple where the numbers represent the mean, minimum and maximum value. The points are as follows. Age group: 9 to 10, (58, 62, 57). Age group: 11 to 12, (62, 58, 63). Age group: 13 to 14, (64, 62, 66). Age group: Adult, (66, 64, 67). A horizontal dashed line intersecting the y-axis at 50 represents the Level of Chance. All values are estimated.

Predictive accuracy of entrainment models by age group. Here, error bars represent standard error. The solid line represents the trajectory of entrainment development as represented by data analyzed within the study. Although no data were collected for a late adolescence group, the dotted line represents a possible continued trajectory for entrainment development across this time period.