. 2023 Apr 18;66(8 Suppl):3132–3150. doi: 10.1044/2023_JSLHR-22-00263

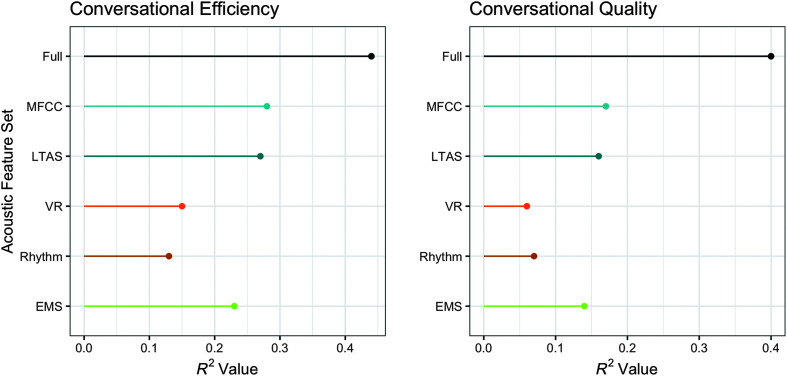
Figure 8.

A plot comparing the R squared values over 6 acoustic feature sets for conversational efficiency and conversational quality. The R squared values with respect to the feature set for conversational efficiency are as follows. E M S: 0.24. Rhythm: 0.14. V R: 0.15. L T A S: 0.27. M F C C: 0.27. Full: 0.44. The R squared values with respect to the feature set for conversational quality are as follows. E M S: 0.14. Rhythm: 0.7. V R: 0.6. L T A S: 0.16. M F C C: 0.17. Full: 0.4. All values are estimated.

Predictive accuracy for conversational success by acoustic feature set. Full represents models containing all acoustic feature sets. EMS = envelope modulation spectrum; LTAS = long-term average spectrum; MFCC = mel-frequency cepstrum coefficient; VR = voice report.