Figure 1.
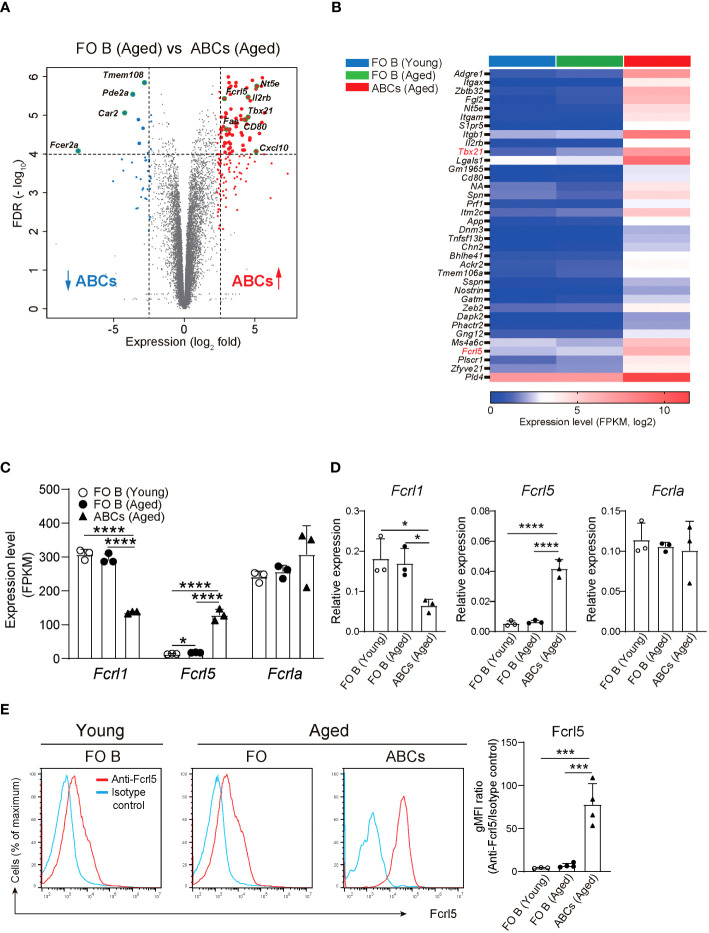
Identification of differentially expressed genes in ABCs. (A) Differential gene expression in FO B (CD19+B220hiCD43–CD23+CD21lo) and ABCs (CD19+B220hiCD43–CD23–CD21loCD11b+CD11c+) from aged WT mice, presented as a volcano plot showing genes expressed in ABCs relative to their expression in FO B cells (n=3 mice each), plotted against log2 fold change >2.3 and FDR<0.01. (B) Selected gene expression of the highly expressed gene in ABCs compared to FO B cells sorted from young and aged WT mice (n=3 mice each) with the parameters; log2 fold change >2.5, FDR<0.01 and adjusted P value <0.00002. (C) Relative expression (FPKM) of Fcrl1, Fcrl5, and Fcrla mRNA in sorted FO B cells and ABCs from young or aged WT mice (n=3 mice each). FPKM, fragments per kilobase of transcript per million reads mapped. (D) Relative expression of Fcrl1, Fcrl5, and Fcrla analyzed by qPCR in sorted FO B cells and ABCs from young or aged WT mice (n=3 mice each). (E) Representative histograms (left) and gMFIs (right) of Fcrl5 expression on FO B cells and ABCs from young (n=3) or aged (n=4) WT mice. gMFI, geometric mean fluorescence intensity. Data are representative of three independent experiments. Statistical data are shown as mean values with s.d., and data were analyzed by one-way ANOVA with Tukey’s multiple comparisons test. *P<0.05, ***P<0.001, ****P<0.0001.

