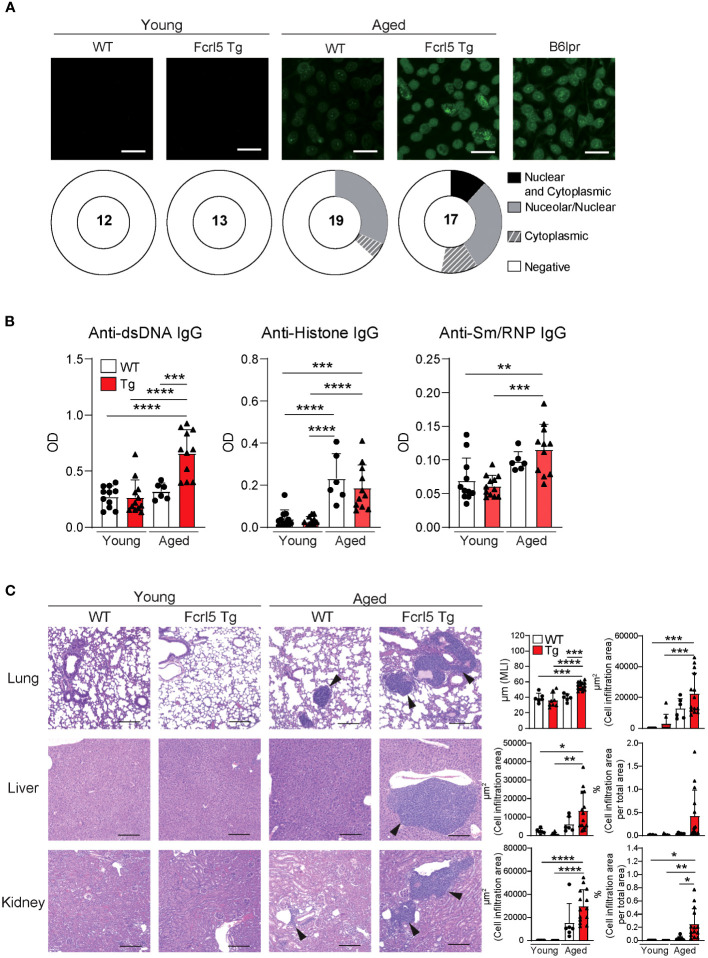
Figure 2.
Aged Fcrl5 Tg mice develop autoimmune disease. (A) Representative images of ANA staining obtained with serum from young WT (n=12), young Fcrl5 Tg (n=13), aged WT (n=19), and aged Fcrl5 Tg (n=17) mice, detected by immunofluorescence assay using HEp-2 cells. Scale Bars, 50 μm. Data are pooled from three independent experiments. (B) Autoantibody production against dsDNA, histone, and Sm/RNP (ribonucleoprotein) in serum isolated from young WT (n=11), young Fcrl5 Tg (n=12), aged WT (n=6), and aged Fcrl5 Tg (n=11) mice, assayed by ELISA. OD, optical density. Data are pooled from three independent experiments. (C) Left, representative H&E-stained histological lung, liver, and kidney images of young WT (n=6), young Fcrl5 Tg (n=8), aged WT (n=6), and aged Fcrl5 Tg (n=14) mice. Arrowheads indicate areas of cell infiltration. Scale bars, 200 μm. Data are representative of three independent experiments. Right, quantitated cell infiltration (cell infiltration area per total area) in the lung, liver, and kidney and mean linear intercept (MLI) in the lung of young WT (n=6), young Fcrl5 Tg (n=8), aged WT (n=6), and aged Fcrl5 Tg (n=14) mice. Data are pooled from three independent experiments. Statistical data are shown as mean values with s.d., and data were analyzed by one-way ANOVA with Tukey’s multiple comparisons test. *P<0.05, **P<0.01, ***P<0.001, ****P<0.0001.

