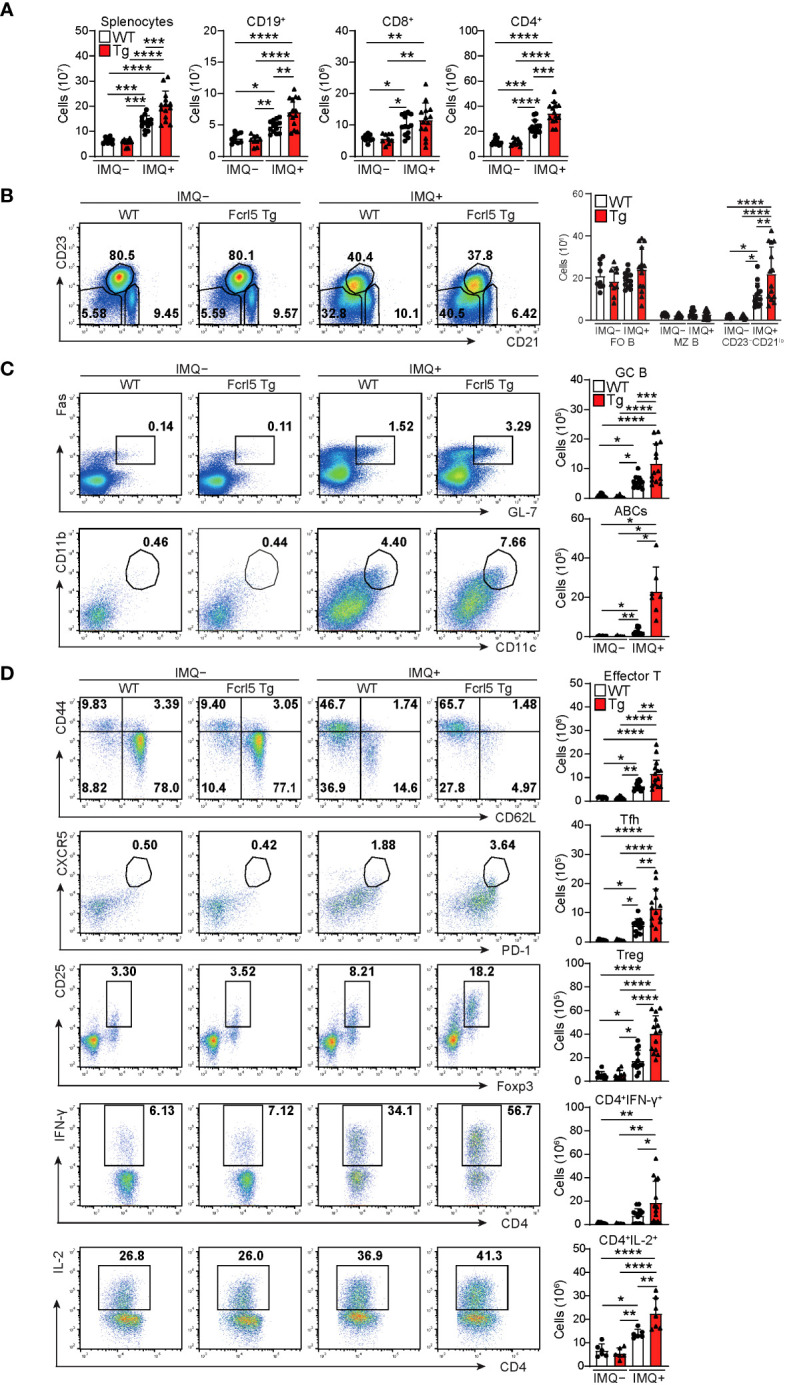
Figure 4.

Enhanced activation of lymphocytes in imiquimod-treated Fcrl5 Tg mice. (A) Absolute number of splenocytes, CD19+, CD8+, and CD4+ in spleen from imiquimod-untreated (IMQ–) WT (n=9) and Fcrl5 Tg (n=9) or -treated (IMQ+) WT (n=13) and Fcrl5 Tg (n=14) mice. Data are pooled from three independent experiments. (B) Representative flow cytometry plots and absolute numbers of CD23–CD21lo (CD19+CD93–CD23–CD21lo), FO B (CD19+CD93–CD23+CD21lo), and MZ B (CD19+CD93–CD23–CD21hi) cells from imiquimod-untreated (IMQ–) WT (n=9) and Fcrl5 Tg (n=9) or -treated (IMQ+) WT (n=13) and Fcrl5 Tg (n=14) mice. Data are pooled from three independent experiments. (C) Top, representative flow cytometry plots, frequencies, and absolute numbers of GC B (B220+Fas+GL7+) cells from imiquimod-untreated (IMQ–) WT (n=9) and Fcrl5 Tg (n=9) or -treated (IMQ+) WT (n=13) and Fcrl5 Tg (n=14) mice. Bottom, representative flow cytometry plots and absolute numbers of ABCs (CD19+B220hiCD23–CD21loCD11b+CD11c+) from imiquimod-untreated (IMQ–) WT (n=6) and Fcrl5 Tg (n=6) or -treated (IMQ+) WT (n=10) and Fcrl5 Tg (n=7) mice. Data are pooled from two or three independent experiments. (D) Representative flow cytometry plots (left) and absolute numbers (right) of CD4+ T cell subsets: effector T (CD4+CD25–CD62L–CD44hi), Tfh (CD4+CXCR5+PD-1+), Treg (CD4+CD25+Foxp3+), CD4+IFN-γ+, and CD4+IL-2+ cells from imiquimod-untreated (IMQ–) WT (n=6–9) and Fcrl5 Tg (n=6–9) or -treated (IMQ+) WT (n=6–13) and Fcrl5 Tg (n=7–14) mice. Data are pooled from two or three independent experiments. Statistical data are shown as mean values with s.d., and data were analyzed by one-way ANOVA with Tukey’s multiple comparisons test (A–D) or Brown-Forsythe and Welch ANOVA with Dunnett’s T3 multiple comparisons test (C). *P<0.05, **P<0.01, ***P<0.001, ****P<0.0001.
