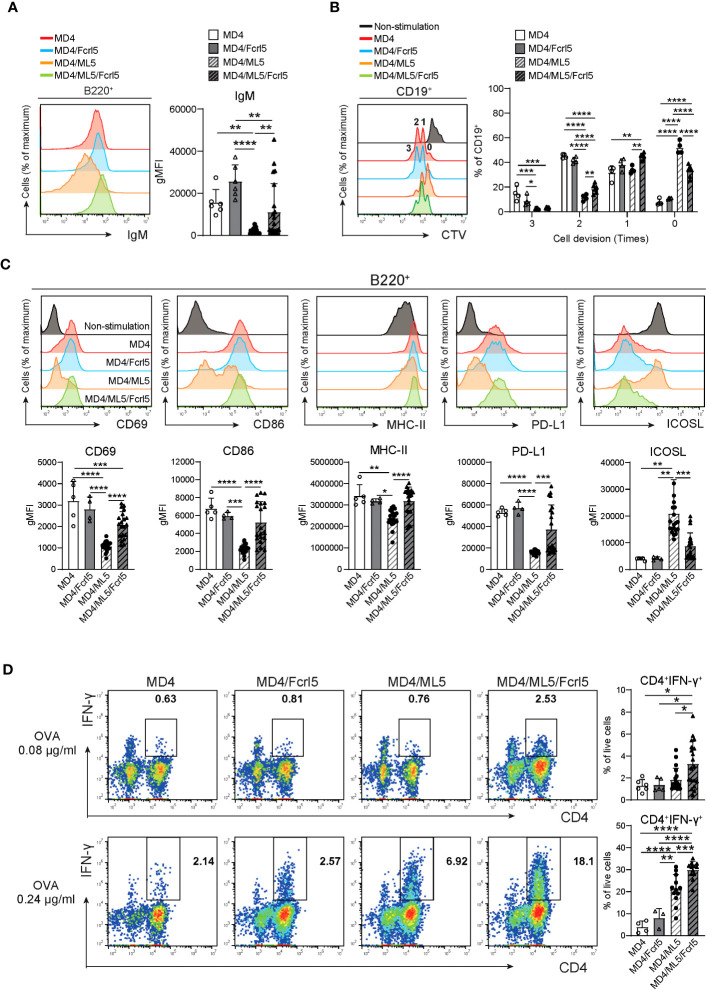
Figure 6.
Fcrl5 upregulation causes a break in B cell anergy. (A) A representative histogram and gMFI of cell-surface IgM on B cells from MD4 Tg (n=6), MD4/Fcrl5 Tg (n=6), MD4/ML5 Tg (n=21), and MD4/ML5/Fcrl5 Tg (n=21) mice. gMFI, geometric mean fluorescence intensity. Data are pooled from three independent experiments. (B) Proliferation of CD19+ cells isolated from MD4 Tg (n=4), MD4/Fcrl5 Tg (n=4), MD4/ML5 Tg (n=4), and MD4/ML5/Fcrl5 Tg (n=6) mice. CD19+ cells are stimulated with HEL + IL-4. Data are pooled from three independent experiments. (C) Representative histograms and gMFIs of CD69, CD86, MHC-II, PD-L1, and ICOSL expression level on splenic CD19+ cells isolated from MD4 Tg (n=5), MD4/Fcrl5 Tg (n=4), MD4/ML5 Tg (n=20), and MD4/ML5/Fcrl5 Tg (n=20) mice after HEL stimulation. Data are pooled from three independent experiments. (D) Frequencies of CD4+IFN-γ+ cells derived from co-culture of OT-II T cells in the presence of OVA peptide with CD19+ cells purified from MD4 Tg (n=4–6), MD4/Fcrl5 Tg (n=3–5), MD4/ML5 Tg (n=12–19), and MD4/ML5/Fcrl5 Tg (n=12–19) mice. Data are pooled from two or three independent experiments. Statistical data are shown as mean values with s.d., and data were analyzed by one-way ANOVA with Tukey’s multiple comparisons test. *P<0.05, **P<0.01, ***P<0.001, ****P<0.0001.

