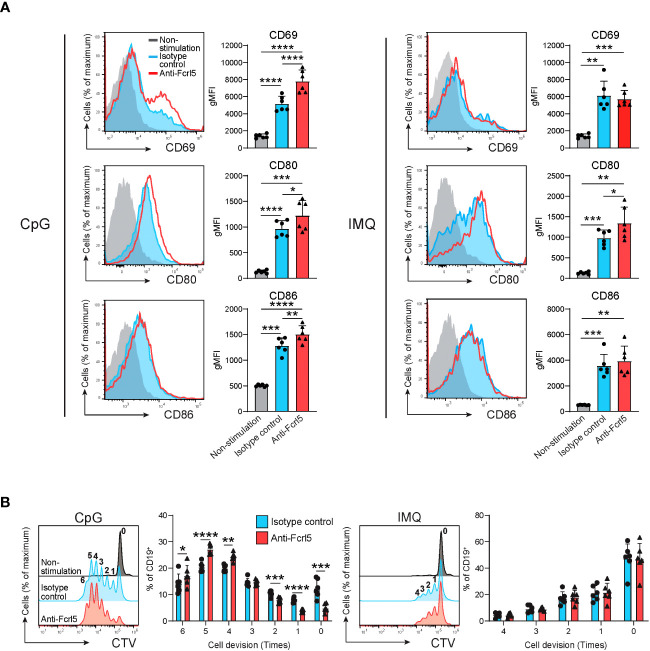
Figure 7.
Fcrl5 ligation augments TLR7/9 signaling. (A) Representative histograms and gMFIs of CD69, CD80, and CD86 expression levels on splenic CD19+ cells from Fcrl5 Tg mice (n=6) stimulated with CpG (left) or imiquimod (IMQ) (right) in the presence of anti-Fcrl5 F(ab’)2 Biotin or isotype control. Data are pooled from two independent experiments. (B) Proliferation of CD19+ cells from Fcrl5 Tg mice (n=6) stimulated with CpG (left) or imiquimod (IMQ) (right) in the presence of anti-Fcrl5 F(ab’)2 Biotin or isotype control. Data are pooled from two independent experiments. Statistical data are shown as mean values with s.d., and data were analyzed by one-way ANOVA with Tukey’s multiple comparisons test (A) or paired t-test (B). *P<0.05, **P<0.01, ***P<0.001, ****P<0.0001.

