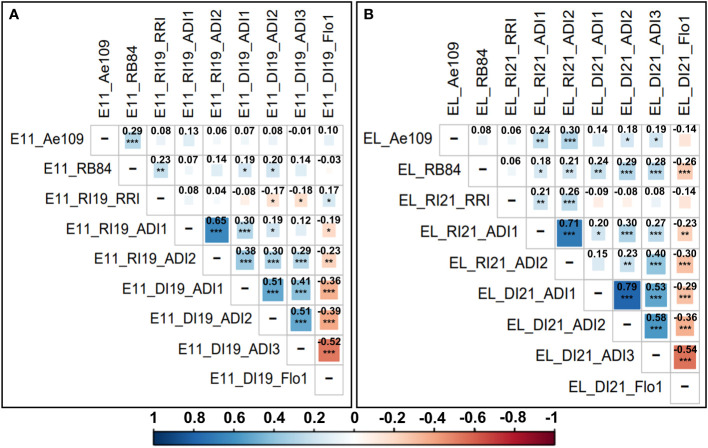
Figure 1.
Correlogram and Pearson correlation coefficients between the different adjusted mean scoring data variables obtained for resistance to A. euteiches and flowering traits in the (A) Eden x E11 and (B) Eden x LISA AB populations. Scoring variables are coded as follows: population (E11 = Eden x E11 and EL = Eden x LISA); location (DI = Dijon-Epoisses, Côtes d’Or and RI = Riec-sur-Belon, Finistère (France)); experimental year (19 = 2019 and 21 = 2021); criterion (controlled conditions: Ae109 and RB84 = A euteiches strains belonging to the pathotype III and I, respectively; field: ADI = Aerial Disease Index, Flo1 = Number of calendar days to 50% bloom, RRI = Root Rot Index). Pearson correlation coefficients are indicated in bold. Level of correlation is coded with a color gradation scale from dark blue or red (r = ± 1) to white (r = 0). Significance p-value codes: 0 < ‘***’ ≤ 0.001 < ‘**’ ≤ 0.01 < ‘*’ ≤ 0.05.

