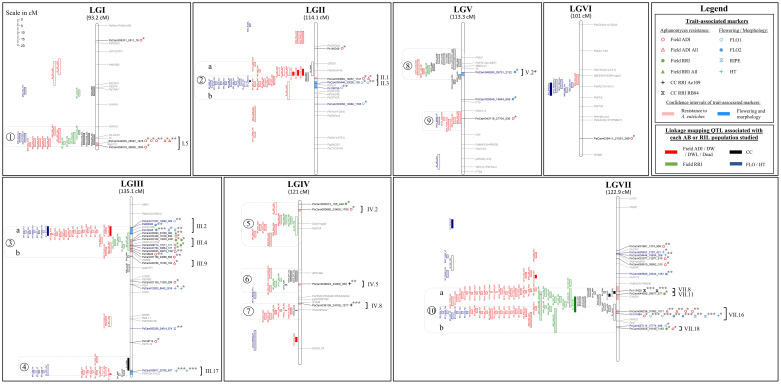
Figure 2.
Comparative genetic mapping of markers and LD blocks identified by GWAS, and QTL detected by AB and RIL linkage analyses, for resistance to A. euteiches. LG names from I to VII and LG sizes in cM Haldane. (i) On the right of each LG: names of significant SNPs identified by GWAS in black and blue with, in red and blue shading in the LG bar, the confidence intervals around the significant SNPs (r2 > 0.7) for resistance and flowering/morphology, respectively; names and genomic positions of cloned pea genes in grey; on the right of each SNP significant marker, symbol(s) for the trait(s) associated markers as described in the legend, and significance of the marker-trait association (p-value: ‘***’ ≤ 1.E-12 < ‘**’ ≤ 1.E-6 < ‘*’); on the far right of each LG, names of the defined LD blocks according to Desgroux et al. (2016), with brackets gathering the markers attributed to the same LD block (r2 > 0.7). (ii) On the left of each LG: QTL detected by linkage mapping for the different variable types studied, as described in the legend; empty and filled rectangles for QTL from Eden x LISA and Eden x E11 AB populations, respectively; diagonal, horizontal, vertical, and crossed bar rectangles for QTL from Baccara x 552, Baccara x PI180693, DSP x 90-2131 and Puget x 90-2079 RIL populations, respectively; rectangle lengths as QTL confidence intervals (one LOD drop-off); on the far left of QTL, numbers from 1 to 10 surrounded by grey dotted rectangles, for consistent genetic regions of partial resistance to A. euteiches; sub-regions a and b delimited by grey dotted lines in regions 2, 3 and 10, to separate resistance QTL colocalizing or not with flowering or morphological QTL.

