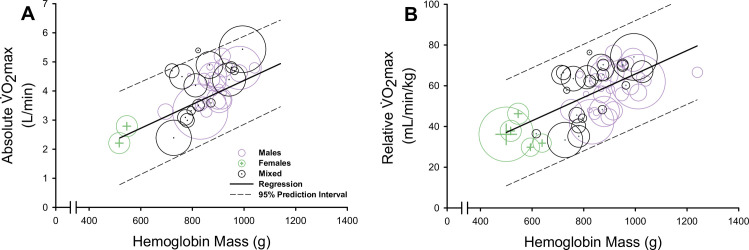
Fig 2. The association between hemoglobin mass and maximal oxygen uptake ().
Bubble plots and meta-regressions displaying the positive association between hemoglobin mass and both absolute (A) and relative (B). Data for males are represented as purple bubbles, data for females are represented as green bubbles with plus sign symbols, and data for studies presenting males and females pooled (mixed) are represented as black bubbles with middle dot symbols. Each bubble represents a group from a single study and the size of bubbles represents the number of participants within the group. The solid line indicates the meta-regression line, and the dashed lines indicate the 95% prediction interval associated with the meta-regression.

