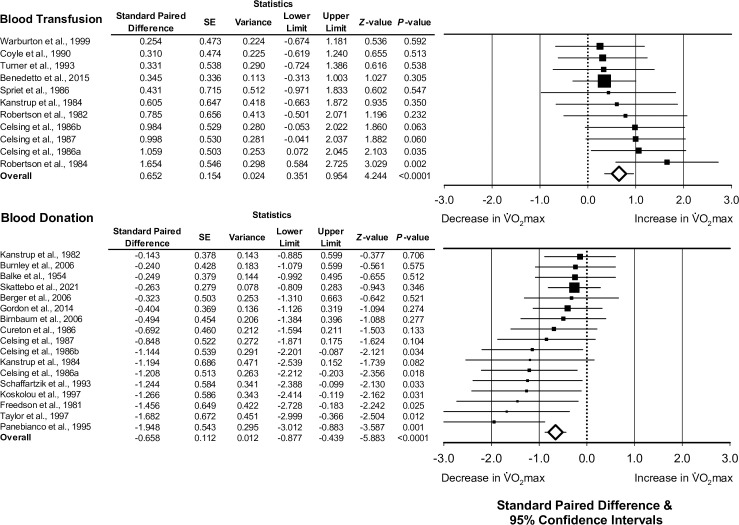
Fig 3. The association between blood donation or transfusion and change in maximal oxygen uptake (absolute ).
Forest plots depicting the effect size of the change of absolute (standard paired difference) following blood transfusion or donation. Different size symbols indicate relative weights used in meta-analyses and are proportional to study size. Abbreviations: SE, standard error.

