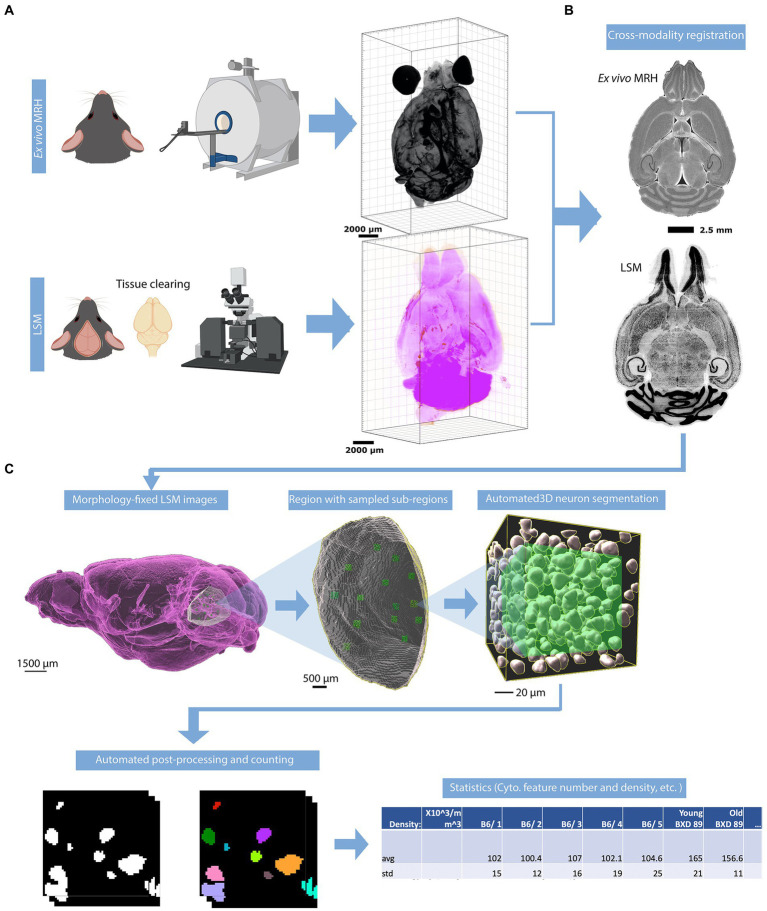
Figure 1.
Overview of the workflow for assessing the density of neurons. (A) The mouse brain is imaged using two modalities: MRH imaging while the brain is in the skull, followed by LSM after the brain is removed from the skull and subjected to tissue clearing. (B) The LSM data are pre-processed by registering to MRH correcting the deformation in brain morphology. (C) The automated workflow locates the region with the label from r1CCFv3 and generates random subvolumes within that region to sample, applying the design-based principles of optical fractionation. Neurons in each subvolume are identified via a random forest algorithm followed by 3D watershed and volume filters and counted.

