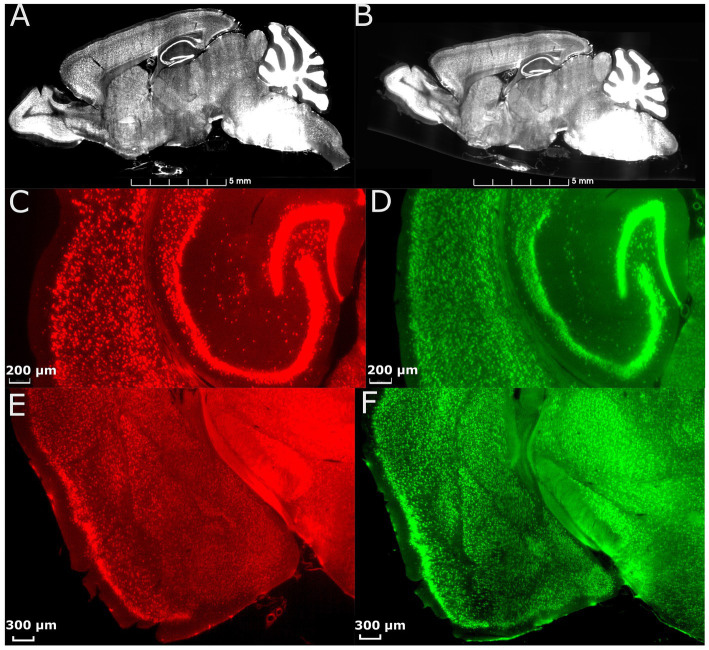
Figure 2.
Effect of morphology correction on light-sheet datasets. (A) A single slice from a whole-brain LSM before correction. (B) The same slice as in (A) after correction using MRH. Magnified axial views of auditory areas and hippocampus before (C) and after (D) correction, and coronal views of the anterior temporal and posterior diencephalic region (showing the amygdaloid complex) before (E) and after (F) correction. The specimen is the same on both sides, and the colormap is used to illustrate the contrast between before and after correction.

