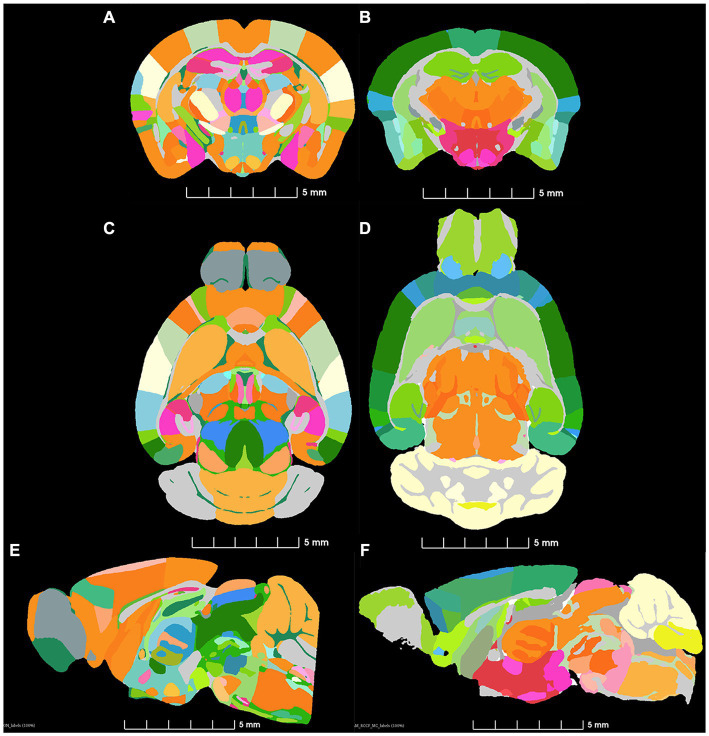
Figure 3.
Comparison of similar levels from the ABA (A,C,E) and a single specimen imaged by MRH. (B,D,F) The colormaps are different because the ABA atlas is shown with the full complement of 461 (CCFv3) labels and the MRH is shown with the reduced (r1CCFv3) labels in which some ROI have been combined.

