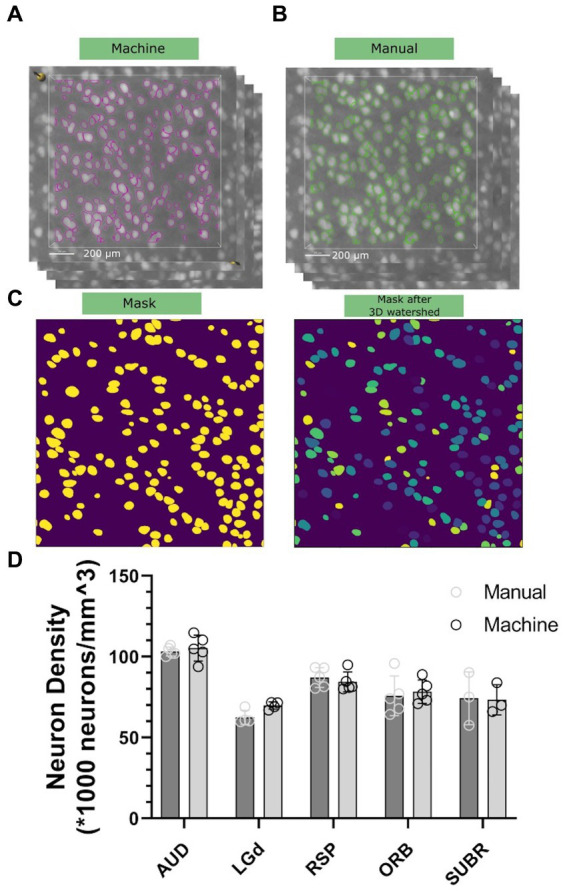
Figure 4.

Comparison of neuron density between the machine workflow (A) and manual counting (B). Note that both the labeling will go through watershed illustrated in (C) to ensure the connected surfaces are separated. Standard deviation is shown in (D), representing statistical variations across five different 90-day C57BL/6J specimens.
