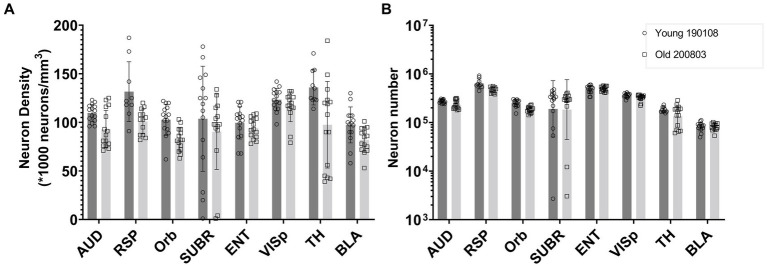
Figure 6.
Comparison of the neuron density (A) and number (B) in multiple brain regions of a young and an old BXD89 mouse, demonstrating the application of the workflow to a study of the impact of aging on neuronal populations in a different strain. The error bars in this figure represent the standard deviation of neuron distribution within each region, obtained from subvolumes.

