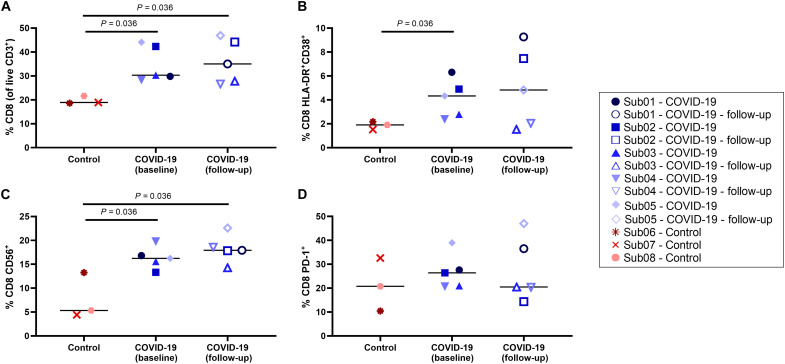
Fig. 8. Peripheral blood CD8+ T cell phenotyping.
(A) Percentage of CD8+ T cells within the live CD3+ population, (B) percentage of activated CD8+ T cells characterized by CD38 and HLA-DR coexpression and (C) CD56 expression, and (D) percentage of exhausted CD8+ T cells characterized by PD-1 expression are compared in all subjects.

