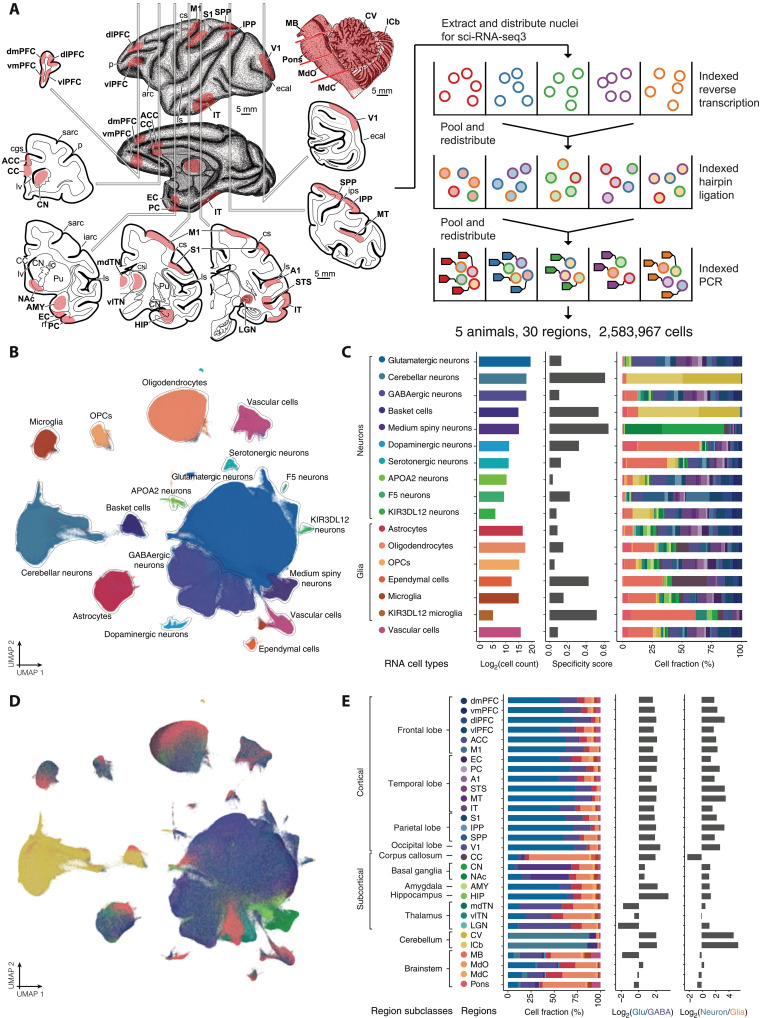
Fig. 1. Experimental setup and summary of the Macaque Brain Atlas snRNA-seq dataset.
(A) Schematic of biopsied brain regions for sci-RNA-seq3 experiment. A full list of sampled regions is provided in table S1. arc, arcuate sulcus; cgs, cingulate sulcus; cs, central sulcus; ecal, external calcarine sulcus; iarc, inferior arcuate sulcus; ic, internal capsule; ips, intraparietal sulcus; ls, lateral sulcus; lv, lateral ventricle; p, principal sulcus; rf, rhinal fissure; sarc, superior arcuate sulcus. (B) UMAP visualization of all snRNA-seq profiled cells colored by cell type [with color code shown in (C)]. (C) Barplots showing the log2 -transformed cell counts (left), regional specificity score (middle), and regional composition [right, with color code shown in (E)] of each cell type. (D) UMAP visualization of all snRNA-seq cells colored by cell type [with color code shown in (E)]. (E) Barplots showing the cell type composition [left, with color code shown in (C)], log2-transformed ratio of glutamatergic neurons and GABAergic neurons (middle), and log2-transformed ratio of neurons and glial cells (right) of each region. Regions are organized by the regional subclass to which they belong.

