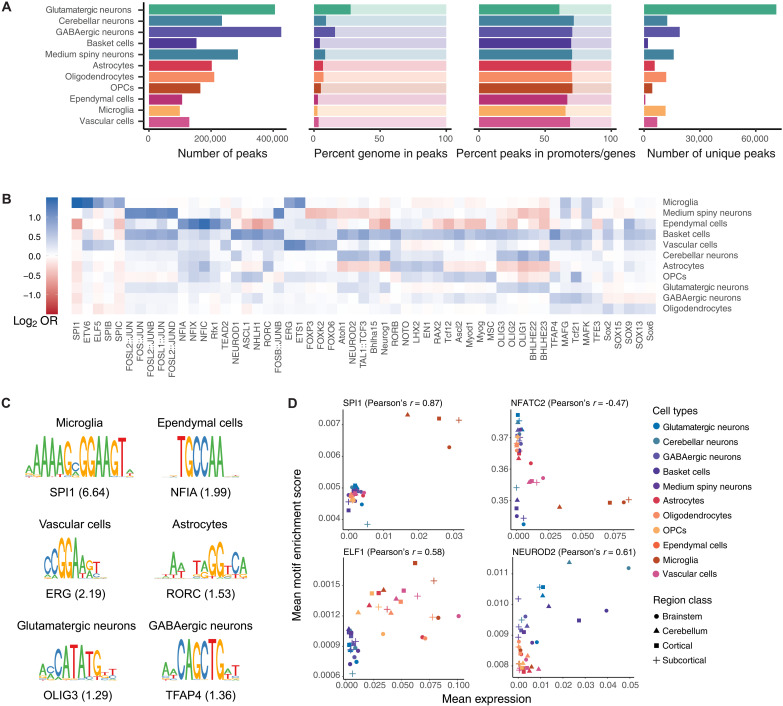
Fig. 4. Enrichment of TF binding site motifs in candidate regulatory elements.
(A) Barplots showing summary statistics for peak sets called separately on reads derived from cells assigned to each of 11 cell classes. (B) Heatmap showing enrichment (log2 OR) of TF binding motifs among cell classes. The top five most-enriched nonredundant TF motifs (all Padj < 0.05) are shown per cell class, ordered from left to right by increasing Padj. Log2 OR color ranges are capped at ±1.5. (C) Position weight matrices of the most-enriched TF motifs for six example cell classes. ORs are shown in parentheses. (D) Scatterplots showing correlation between snATAC-seq accessibility of TF binding motifs and snRNA-seq gene expression of corresponding TF genes within cell classes in regional classes for four example TFs.

