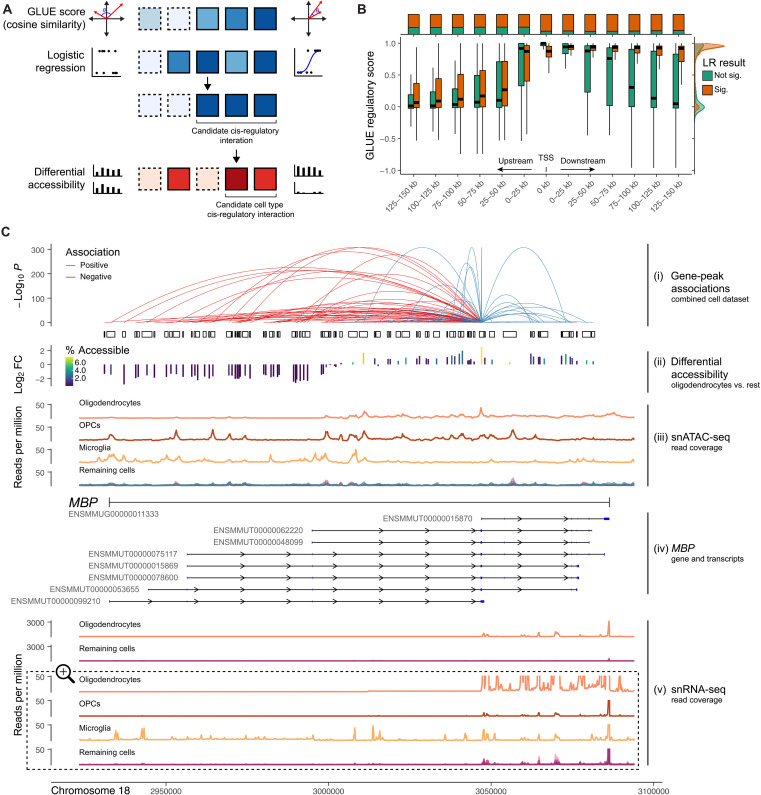
Fig. 5. The landscape of cis-regulatory interactions in the Macaque Brain Atlas.
(A) Schematic outlining criteria for identification of cCREs. Squares represent peak:gene pairs, darker colors symbolize stronger evidence for a given measure, and solid borders represent statistically significant measures. (B) Distribution of gene-peak GLUE regulatory scores binned according to the minimum signed distance (left: upstream, right: downstream) between peaks and gene TSSs. Distributions are shown separately according to whether the gene:peak pair also exhibited a significant association (Padj < 0.05) based on the metacell-based logistic regression analysis. The ratio between significant and not-significant gene-peak pairs for proximity bins according to the logistic regression model is shown in the top margin, while the distribution of GLUE regulatory scores is shown in the right margin. (C) Candidate regulatory elements are shown in relation to, from top to bottom, (i) the strength of and direction of inferred regulatory links connecting peaks to MBP expression (based on metacell logistic regression analysis). The height of links represents the strength (−log10 P values) of evidence for regulatory connections and the color symbolizes the direction of the relationship; (ii) the differential accessibility (−log2 FC) of peaks in oligodendrocytes relative to all other cell classes; (iii) the distribution of normalized snATAC-seq reads by cell class; (iv) gene and transcript boundaries of MBP and its known isoforms in the rhesus macaque genome, with exons shown in blue; (v) the distribution of normalized snRNA-seq reads by cell class. Oligodendrocyte reads are shown in relation to all other cell classes on the upper portion of the plot. On the bottom portion, the y axis is magnified ×60 and cropped to highlight more subtle differences among cell classes.

