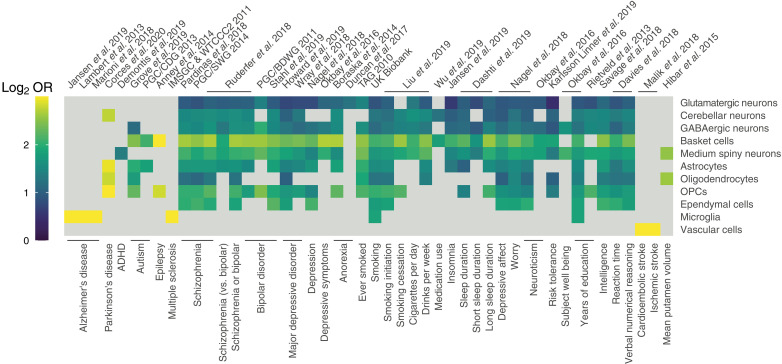
Fig. 6. Enrichment of heritable disease-relevant sites among candidate regulatory elements.
The heatmap displays heritability enrichment (log2 OR) of diseases among cell class snATAC-seq peaks for tested diseases, syndromes, and phenotypes. Only results passing a threshold of Padj < 0.05 are shown. The log2 OR color range is capped at 3.0.

