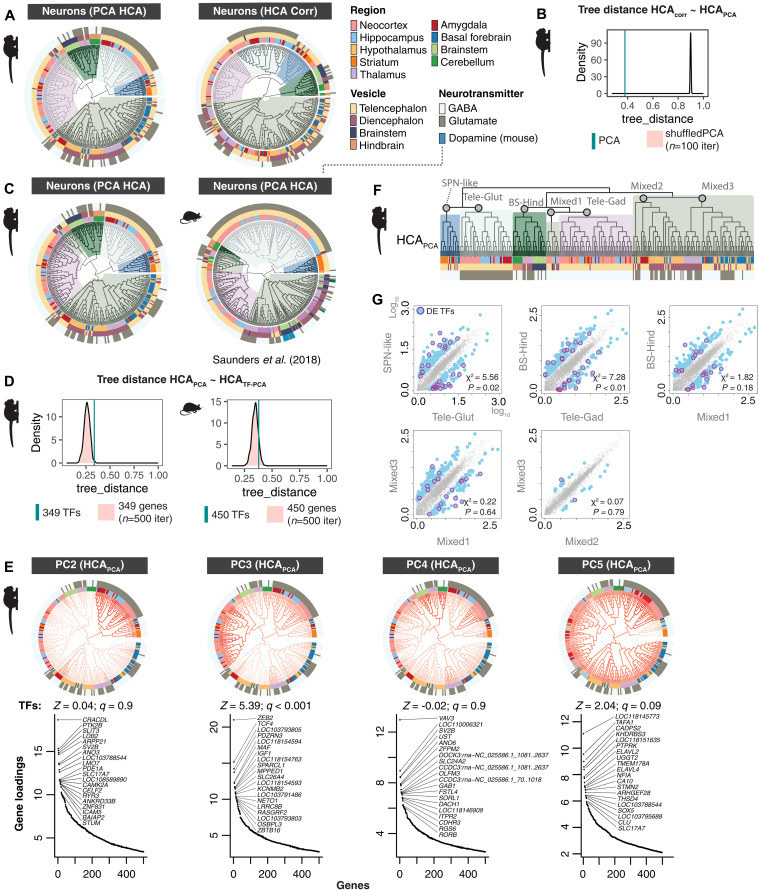
Fig. 3. Conservation of neuronal hierarchy across species and clustering methods.
(A) Comparison between hierarchical clustering (HCA) of marmoset neurons computed on top 100 principal components (PCA) or from a correlation-based distance measure (HCA Corr). (B) Distance between trees computed in (A). Cyan line = tree distance between HCA PCA and HCA Corr. Pink distribution is tree distance scores between HCAcorr and shuffled PCA scores (n = 100 shuffling iterations). Lower values of tree_distance (x axis) indicate higher agreement between dendrogram tree structures. (C) Comparison of marmoset and mouse neurons [mouse atlas data from (4)] using HCA PCA on 5884 genes in marmoset and 3528 1:1 orthologs in mouse. (D) Tree distance comparisons to shuffled distributions using expressed TFs in marmoset and mouse neurons. (E) Top gene loadings for PC2 to PC5 computed over marmoset metacells (table S2). PC scores are plotted on the HCA PCA dendrogram shown in Figs. 1C and 2. Ranked gene loading plots show top 20 genes per PC. Z scores and q values show false discovery rate (FDR)–corrected tests of TF enrichments in top loading genes per PC. (F) Marmoset dendrogram in Fig. 1C (HCAPCA) indicating major clades compared in (G). (G) “Ancestral” reconstruction (AR) of gene expression profiles of major clades of marmoset neuron types from HCA PCA dendrogram using maximum likelihood estimates. Scatterplots show pairwise comparisons between AR of internal nodes of major clades. Blue dots, genes with >3-fold change difference between the two ARs; magenta circles, differentially expressed TFs (DE-TFs). Chi-square and P values describe whether TFs are significantly differentially enriched between the AR pairs.

