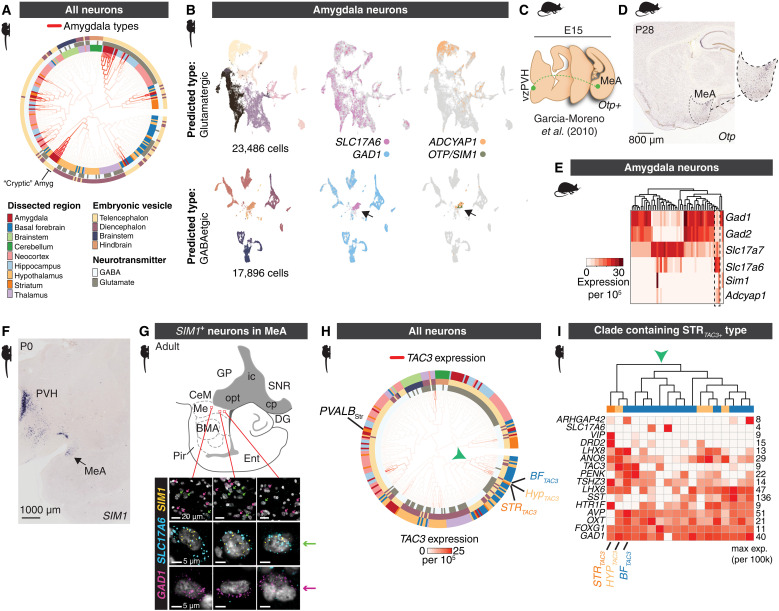
Fig. 4. Examples suggesting cross–cephalic boundary cell type migration.
(A) Locations of amygdala clusters in the neuronal HCA-PCA dendrogram from Fig. 1C. (B) Clustering of marmoset amygdala cells (n = 44,165 neurons) predicted to be glutamatergic (top row) or GABAergic (bottom row) based on a linear classifier (scPred) trained on supervised cell type models. t-distributed Stochastic Neighbor Embedding (t-SNEs) for each class are colored by cluster or positive expression of genes (SLC17A6, GAD1, ADCYAP1, OTP, SIM1). Arrowhead indicates cluster of neurons that are classified as GABAergic, yet do not express GAD1 and do express SLC17A6. (C) Cartoon of embryonic migration of Otp+ cells that migrate from proliferative zones around the third ventricle to periventricular hypothalamus (vzPZH) and medial amygdala (MeA), following data in (51). (D) ISH for Otp in sagittal section of P28 mouse brain. Dotted outline indicates borders of medial amygdala (MeA). (E) snRNA-seq from mouse amygdala neurons. Heatmap shows normalized, scaled expression (n = 25,930 nuclei, 3 replicates pooled). Dendrogram shows hierarchical clustering of neuron types based on all expressed genes. Dotted outline shows the presence of three Slc17a6+ subtypes that preferentially cluster with GABAergic (GAD1+/GAD2+) subtypes and that express Sim1 and/or Adcyap1. (F) Marmoset P0 coronal section showing ISH staining for SIM1 from the marmoset BRAIN/Minds atlas (59, 60). (G) Cartoon of amygdala in sagittal plane of adult marmoset. FISH staining for GAD1 (magenta), SLC17A6 (cyan), and SIM1 (yellow) in the medial amygdala (Me). Magenta arrows highlight GAD1-expressing nuclei. Green arrows highlight SLC17A6 and SIM1 coexpression. Scale bars, 20 μm (top row) and 5 μm (middle and bottom rows). (H) Marmoset neuronal HCA PCA dendrogram with branches colored by TAC3 expression. Unexpectedly, a primate-specific striatal TAC3 population (10) clusters with hypothalamic and basal forebrain populations. Arrowhead indicates clade containing TAC3+ striatal type. (I) Heatmap of genes expressed in the clade indicated by green arrowhead in (H). Expression values of each gene are normalized to its max within the clade.

