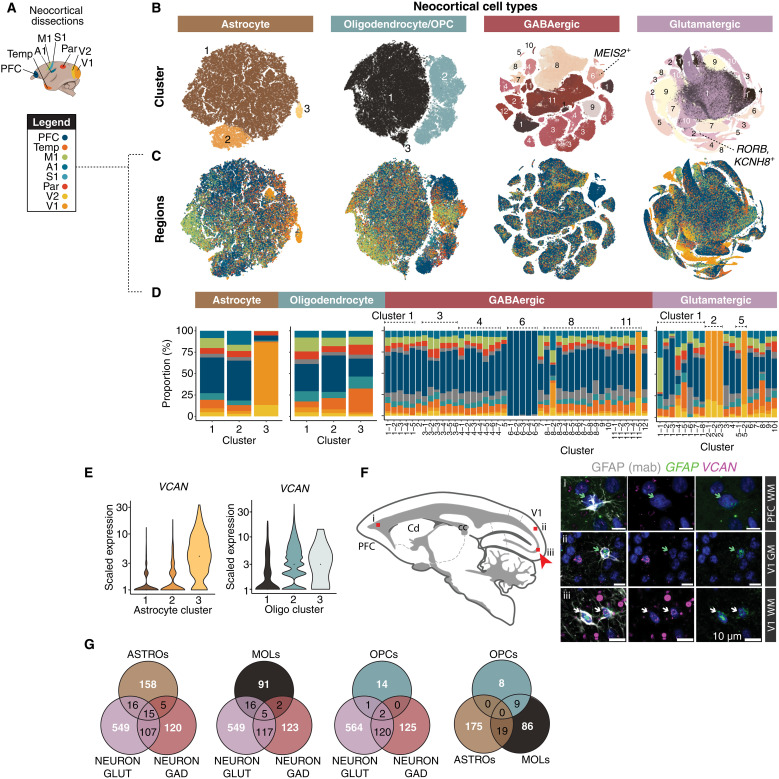
Fig. 5. Regional variation in neocortical cell types and expression patterns.
(A) Cortical regions sampled. (B) t-SNE embeddings of neocortical macroglia (astrocytes, oligodendrocyte lineage types) and neurons (GABAergic interneurons, glutamatergic neurons). Colors represent clusters (numbered). (C) Same as (B) but cells colored by neocortical dissection. (D) Regional proportions of each cluster; colors same as (A). (E) VCAN expression across astrocyte clusters and oligodendrocyte lineage clusters. Colors as in (B). (F) (Left) Cartoon of sagittal section imaged; red boxes (i to iii) correspond to (right) tissue validation of increased abundance of VCAN+ astrocytes in adult marmoset V1-adjacent white matter (iii) compared with PFC-adjacent white matter (i) and V1 gray matter (ii). GFAP antibody (gray) combined with smFISH probes against VCAN (magenta) and GFAP (green). Green arrows correspond to GFAP+ (antibody) and GFAP+ (smFISH) cells. White arrows correspond to GFAP+ (antibody), GFAP+ (smFISH), and VCAN+ cells. V1, visual cortex V1; PFC, prefrontal cortex; GM, gray matter; WM, white matter. Red arrow highlights locale of VCAN+ GFAP+ cells. Scale bar, 10 μm. (G) Venn diagrams showing overlap of neocortical regionally differentially expressed genes (rDEGs) across GABAergic neurons, glutamatergic neurons, astrocytes, and oligodendrocyte lineage cells (MOLs and OPCs). rDEGs are defined as >3-fold expression difference in homologous cell types across pairs of cortical regions.

