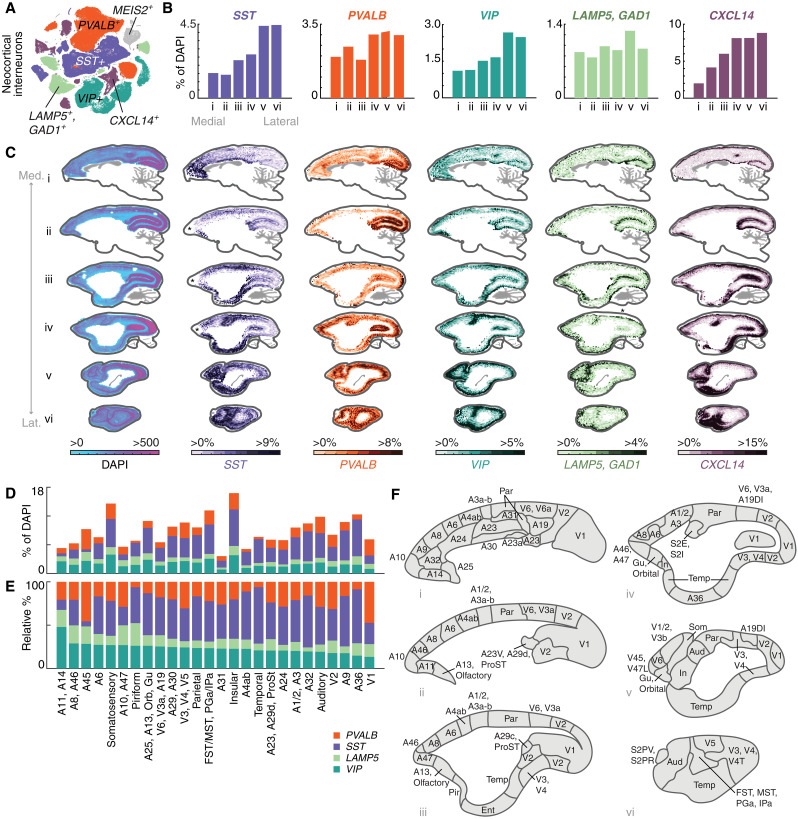
Fig. 6. Cell type–specific distributions of interneurons in marmoset neocortex using quantitative smFISH.
(A) t-SNE of GABAergic neocortical interneurons, colored by subclass marker [PVALB, SST, VIP, LAMP5 (GAD1+), CXCL14]. Gray points are the MEIS2+ population that is restricted to orbitomedial PFC (fig. S1, B and C) and was not spatially profiled. (B) Medial-lateral proportions of each major class as percentage of all cells (DAPI+). Barplots quantify positive cells as proportion of all (DAPI+) cells from medial to lateral sections of smFISH performed on six thin (16 μm) sagittal sections of marmoset neocortex, each section being 1600 μm apart and covering 9600 μm of neocortex. Colors as in (A). (C) smFISH for neocortical interneuron subclass markers showing locations of cells positive for each marker across six sagittal sections of the marmoset neocortex. First column shows density of all DAPI+ nuclei per unit area (approximately 387 μm per bin) profiled from one series. Heatmap scale in subsequent columns shows percentage of marker-positive cells relative to DAPI+ cells. Average proportions across section shown in (B). Med., medial; Lat., lateral. Asterisks in (ii) and (iii) of the SST series and (iv) of the LAMP5 series denote regions where tissue or staining artifacts caused loss of signal. These can be seen in the DAPI-only series of these experiments, which show lower overall cell counts at these locations (fig. S5). (D) Quantitation of interneuron proportions by cortical area parcellated according to (F). (E) Relative percentages of interneuron proportions by cortical area shown in (F), sorted by max relative proportion of VIP+ interneurons. (F) Cartoons of cortical areas and areal groupings used to bin smFISH neocortical interneuron proportions from (A) in (D) and (E). Neocortical parcellation from (76).

