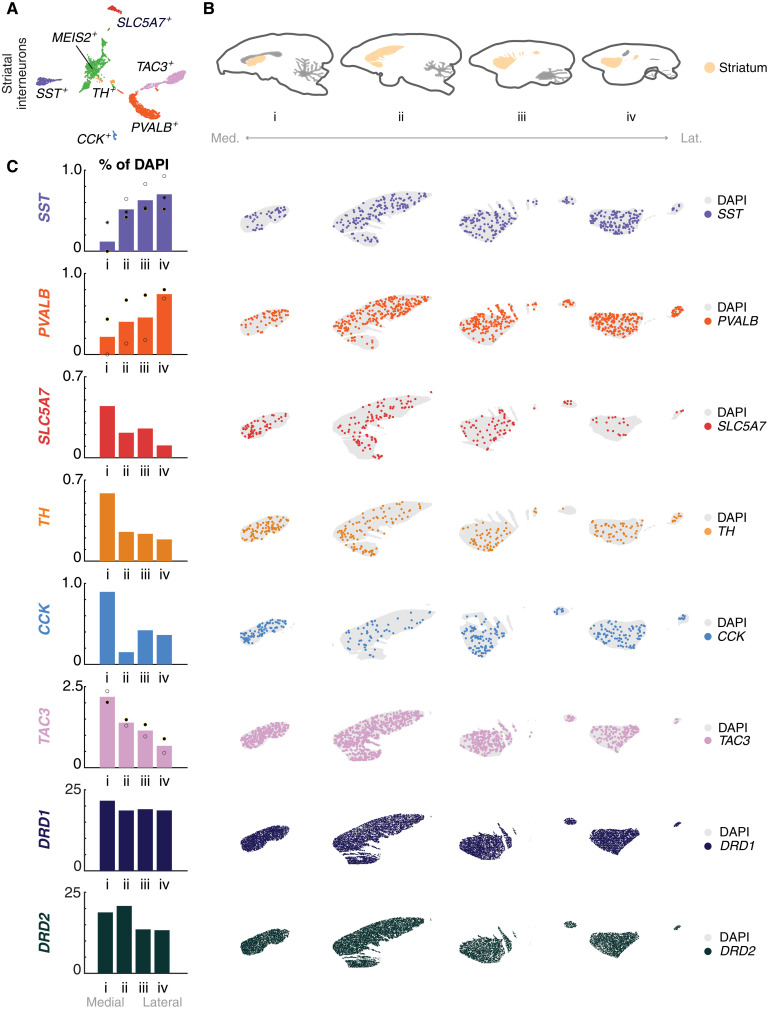
Fig. 7. Cell type–specific distributions of interneurons in marmoset striatum using quantitative smFISH.
(A) t-SNE of striatal, cholinergic neurons (SLC5A7) and GABAergic interneurons (SST, PVALB, TH, CCK, TAC3). Green points correspond to the MEIS2+ population and were not spatially profiled. (B) Cartoon of marmoset striatum illustrating the area profiled, medial to lateral. (C) (Left) Medial-lateral gradients of striatal cell type proportions across four sagittal sections. Dots, individual replicates. Colors as in (A). DRD1, dark blue; DRD2, dark green. (Right) Scatterplot of smFISH for striatal cholinergic and interneuron subclass markers, as well as dopaminergic striatal populations [DRD1+ (dark blue) and DRD2+ (dark green)], showing locations of cells positive for each subclass marker across four (16 μm) sagittal sections of the marmoset striatum, each 1600 μm apart covering 6400 μm in total.

