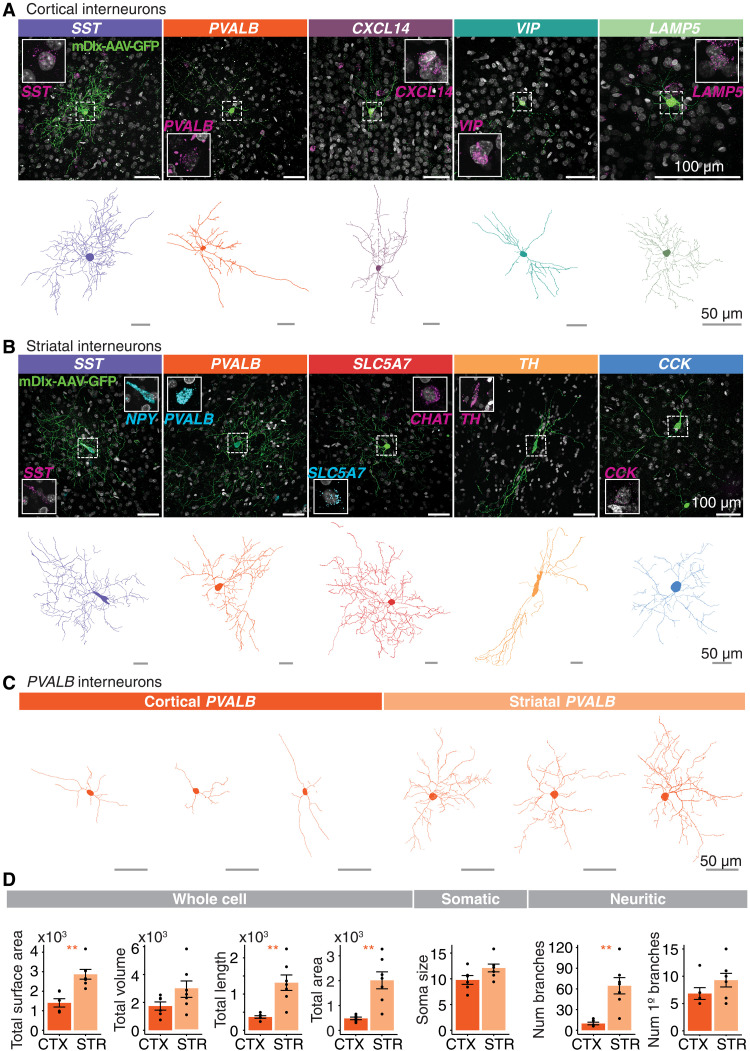
Fig. 8. Morphological characteristics of marmoset cortical and striatal interneurons.
(A and B) Top rows: Examples of AAV9-hDlx5/6-GFP-fGFP labeled neocortical (A) and striatal (B) interneurons. Insets show magnified cell nucleus of GFP+ cell along with smFISH staining for interneuron type marker to confirm molecular identity of labeled cell. Scale bar, 100 μm. Bottom rows: Reconstructed skeletonized morphology (Imaris) of GFP+ cells depicted in the top rows. Scale bar, 50 μm. (C) Representative reconstructed neocortical and striatal PVALB+ interneurons from one marmoset (Cj 17-154; tables S1 and S6). Scale bar, 50 μm. (D) Quantification of morphological characteristics of PVALB+ cells from Cj 17-154. Means ± SEM. *P < 0.05 and **P < 0.01. See Materials and Methods for detailed statistical information.

