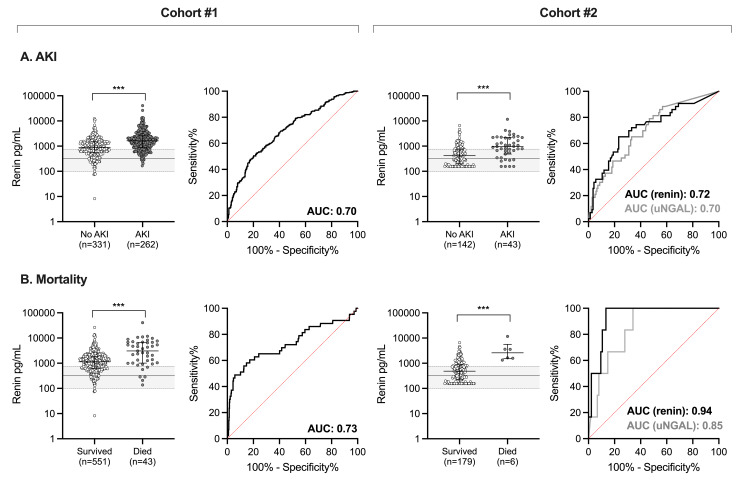
Figure 2. Ability of renin to predict AKI or in-hospital mortality in the two cohorts.
(A) ROC curve showing the ability of increasing renin concentrations to predict AKI in children with SM (Cohort #1) or increasing renin and uNGAL concentrations to predict AKI in children with SCD (Cohort #2); (B) ROC curve showing the ability of increasing renin concentrations to predict mortality in children with SM (Cohort #1) or increasing renin and uNGAL concentrations to predict mortality in children with SCD (Cohort #2). Scatter plots depict renin concentrations with the median and IQR for children with SM or SCD. Gray shading on the plot represents the median (IQR) of renin levels measured in the community children from Cohort #1 as a population reference. Wilcoxon rank-sum test was used where ***p<0.001. The data are presented on log-transformed scale.
ROC: receiver operating characteristic; AKI: acute kidney injury; SM: severe malaria; uNGAL: urine neutrophil gelatinase-associated lipocalin: SCD: sickle cell disease; IQR: interquartile range; AUC: area under the curve

