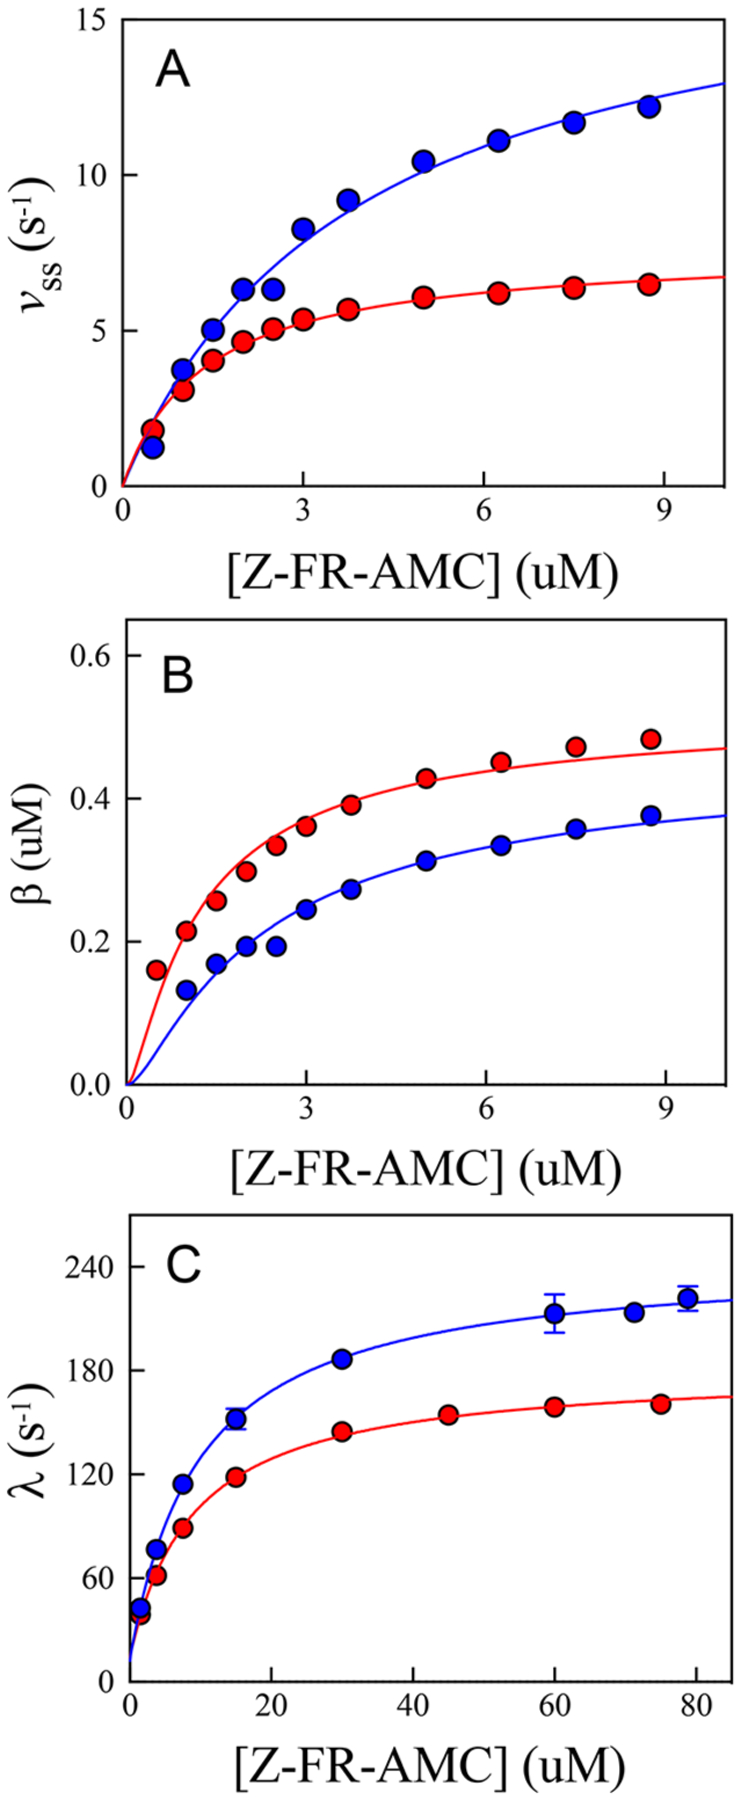
Figure 7.

Replots of the kinetic parameters obtained from fitting individual time courses at each substrate concentration to eqs 8–10 in (blue) and (red). Substrate concentrations used to determine the transient rate constants were 1.5–79 μM, compared to substrate concentrations used for the steady-state rate and burst amplitudes (0.5–8.75 μM). (a) Fitting of the steady-state rate vs [Z-FR-AMC] (eq 1) resulted in the following values: and in , and and in . (b) Fitting of the burst amplitude vs [Z-FR-AMC] (eq 9) resulted in the following values: , and , and , and . (c) Fitting of the transient rate constant vs [Z-FR-AMC] (eq 10) resulted in the following values: , and , and , and .
