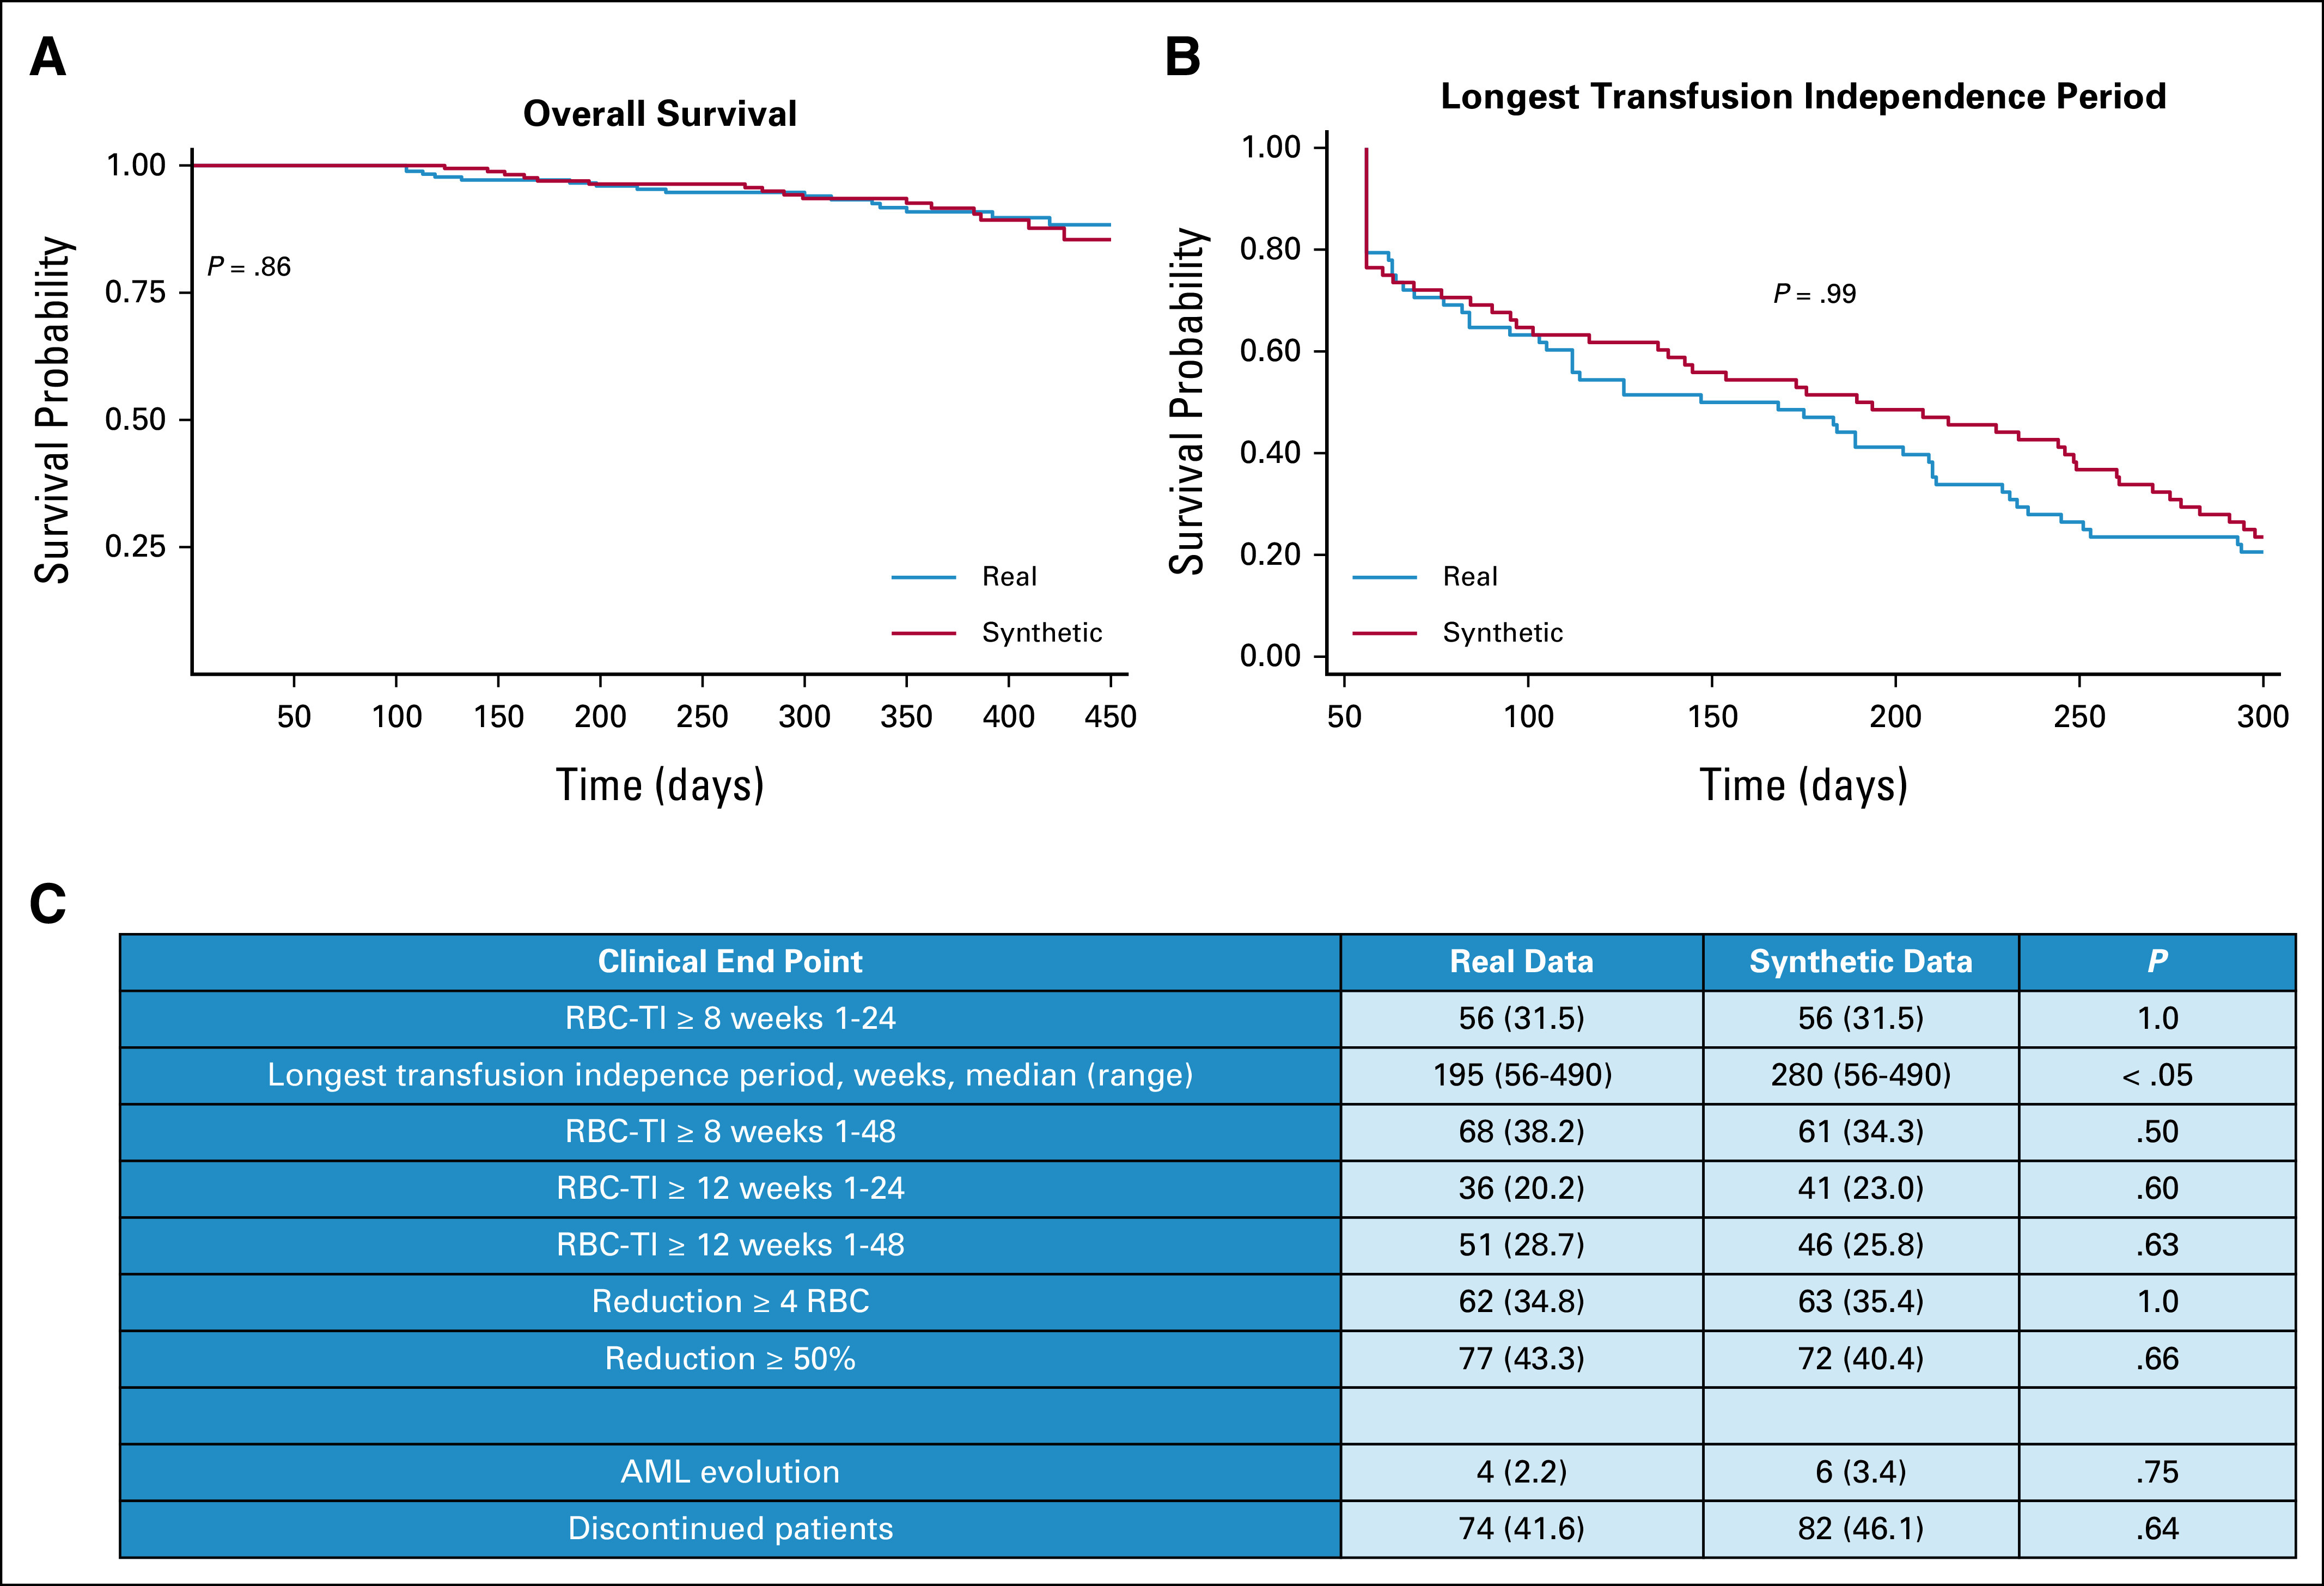
FIG 6.

Comparison of clinical trial end points between real and synthetic patients, as performed in setting D. (A) Kaplan-Meier survival probability curves compared for real and synthetic patients' overall survival. (B) Kaplan-Meier curves of longest transfusion independence period for real and synthetic patients. The P values of the log-rank test are calculated, confirming the hypothesis of no difference in survival probabilities between real and synthetic cohorts. (C) Study end point comparison between real and synthetic cohorts. RBC-TI, rate of red blood cell transfusion independence.
