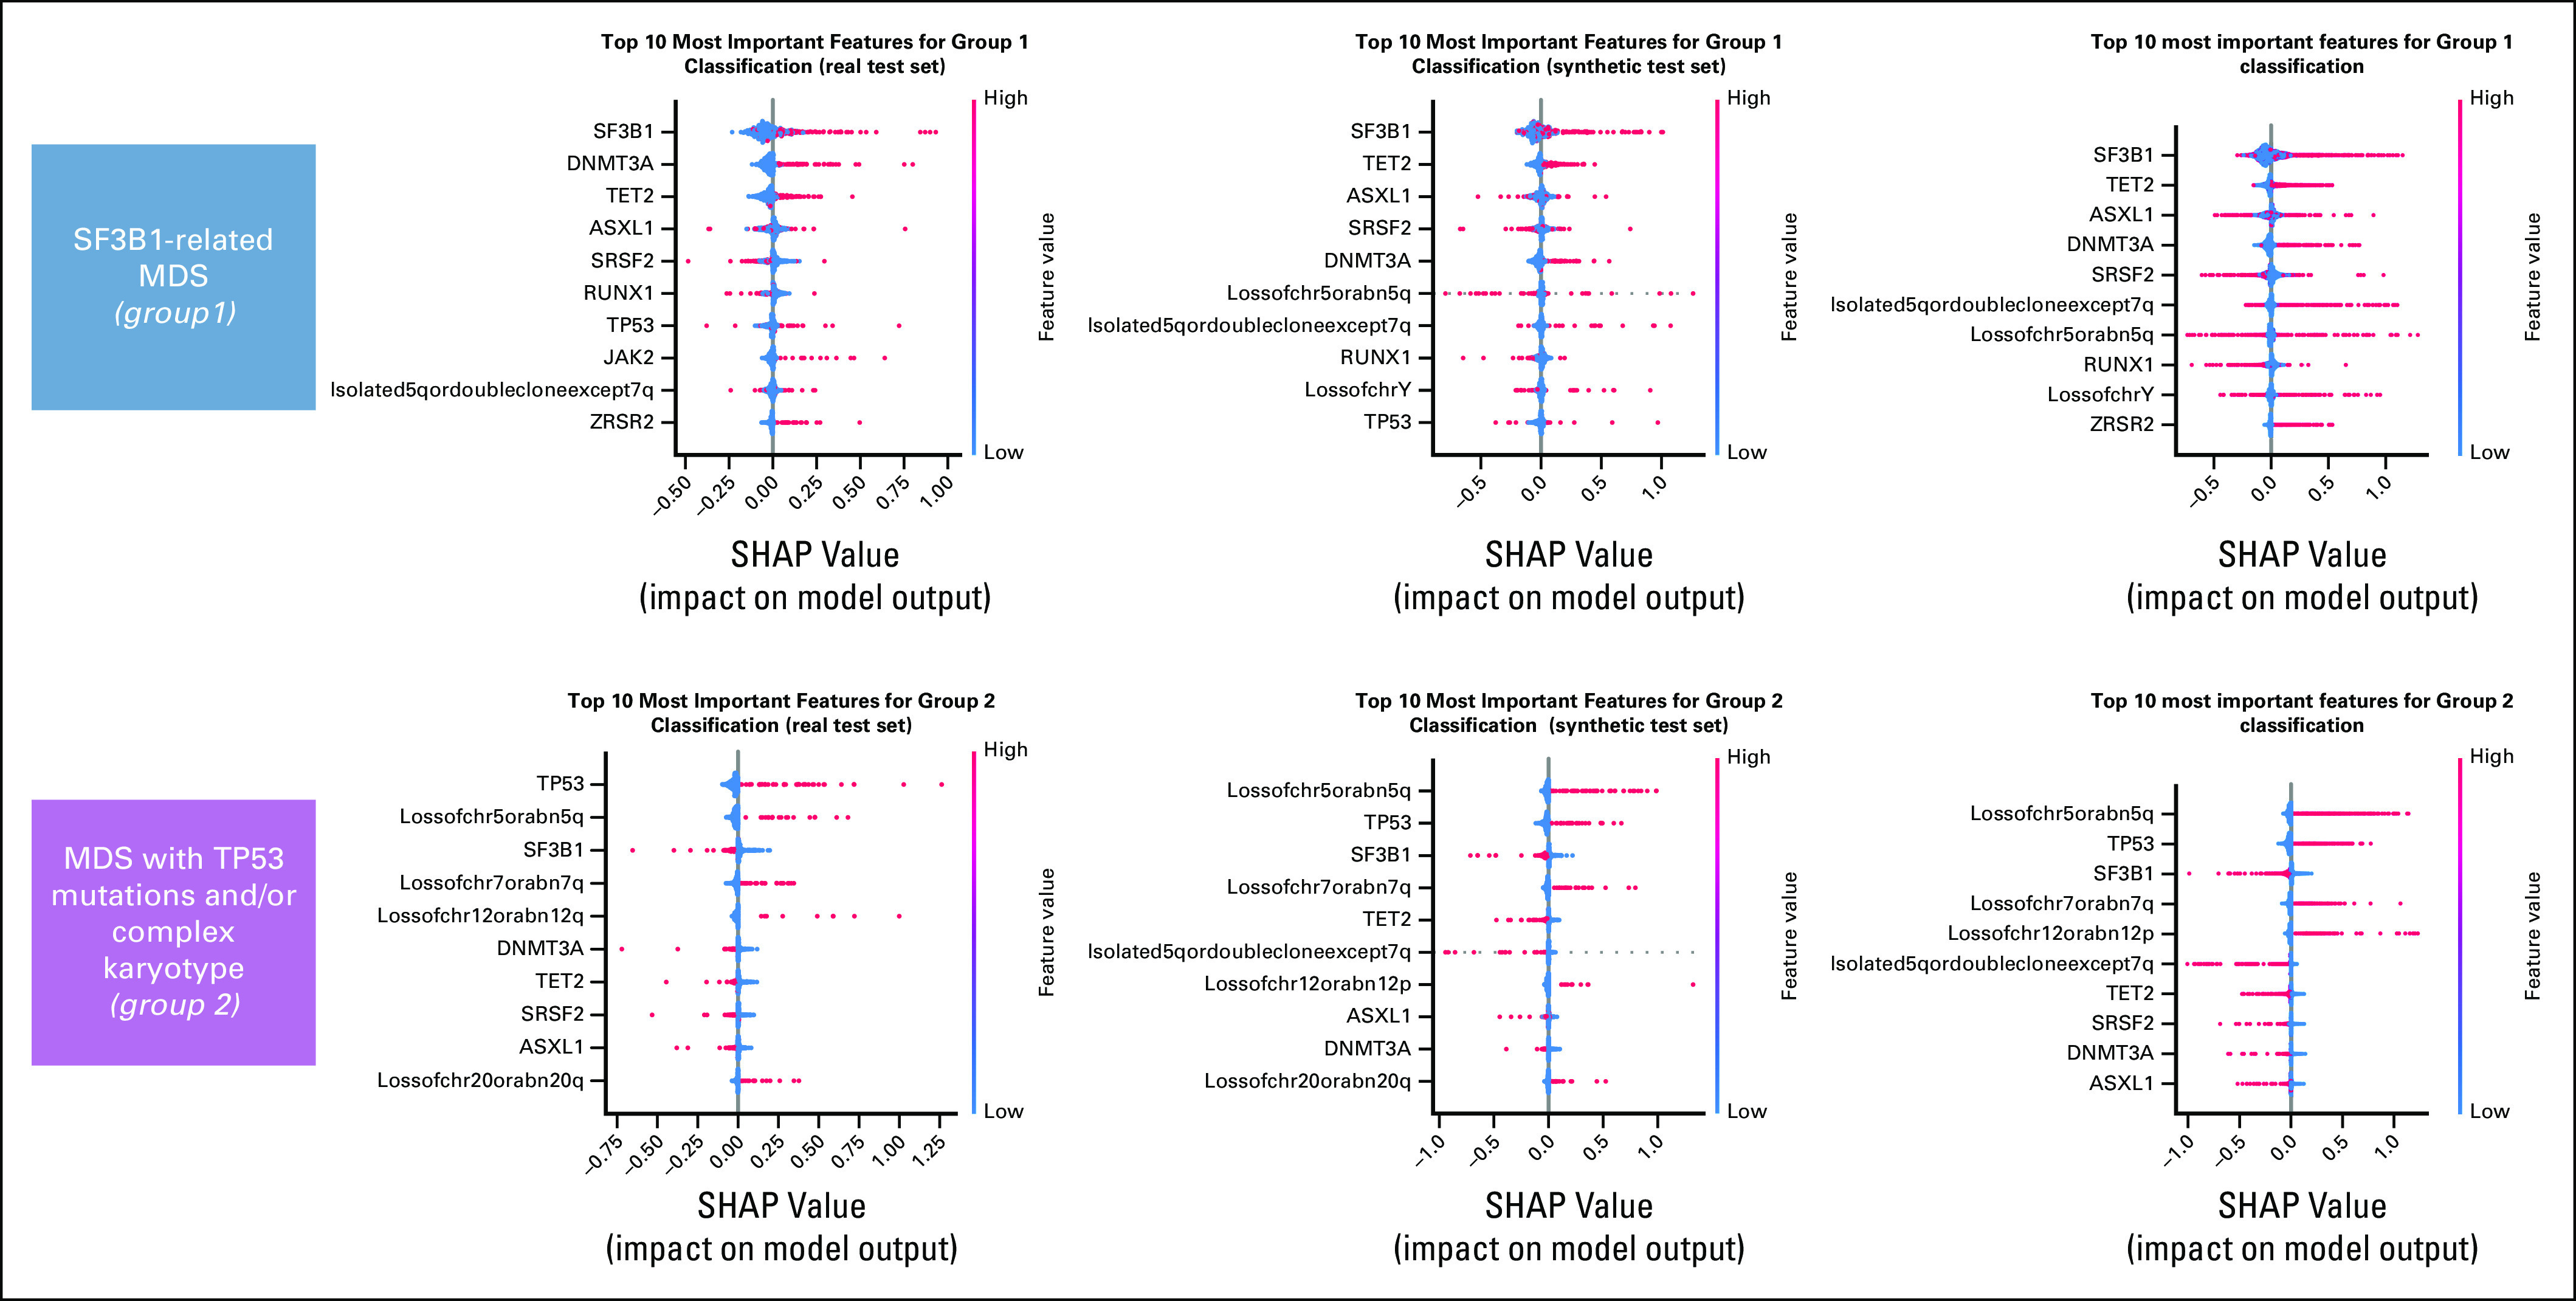
FIG A3.

Definition of a molecular classification on augmented synthetic MDS cohort starting from 944 patients available in 2014, as performed in setting C. SHAP summary plot analysis on the top 10 most important features for a real test set, a synthetic test set, and a complete augmented synthetic data set for the genomic groups 1 and 2. MDS, myelodysplastic syndromes; SHAP, Shapley Additive Explanations.
