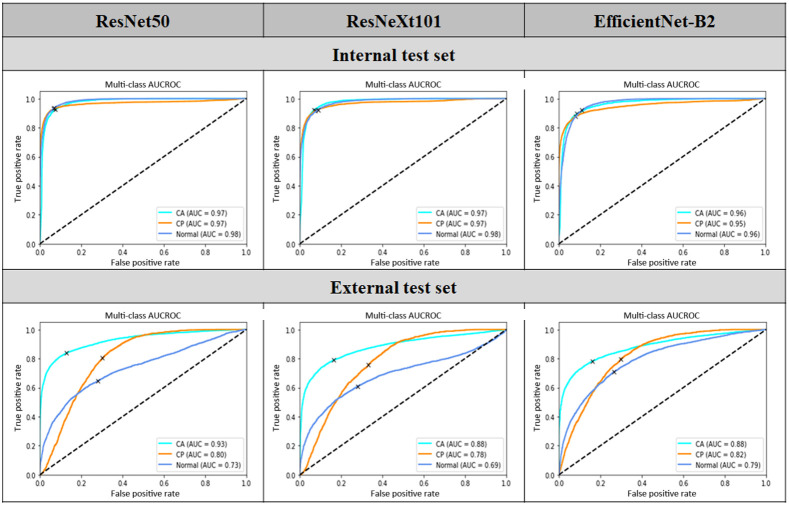
Fig. 7.
Area under the receiver operating curve (AUCROC) curves for all three models were tested framewise. Each column denotes the different models, and each row denotes the internal and external test sets training and testing AUCs as well as the confusion matrix for each model is given in the Supplementary Material.

