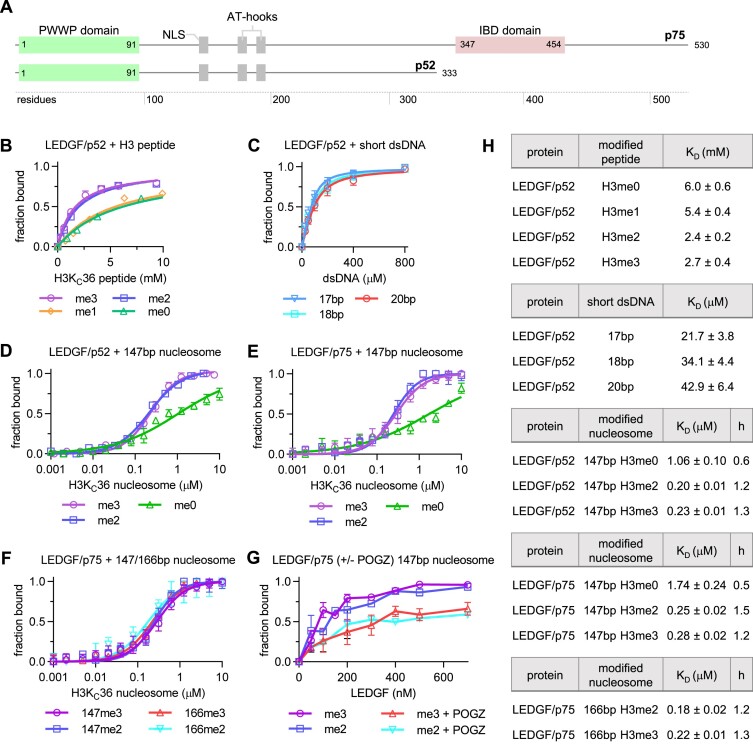
Figure 1.
Binding of LEDGF to unmodified or methylated histone H3-derived peptides, oligonucleotides and NCPs. (A) Domain architecture of the LEDGF splice variants p75 and p52. (B) KD fits from NMR titrations obtained using 15N-labeled LEDGF and the unlabeled short H3-derived peptides (unmodified, mono-, di- and trimethylated at K36). Dissociation constants were determined by following the chemical shift perturbations (CSP) of the LEDGF/p52 backbone amide signals induced upon titration with H3 peptides. Error bars represent the error of the fit for most perturbed residues (n = 10). (C) KD fits from NMR titrations obtained using 15N-labeled LEDGF and three 601-derived dsDNA oligonucleotides (17 bp–cyan, 18 bp – blue and 20 bp – red). Dissociation constants were determined by following the chemical shift perturbations (CSP) of the LEDGF/p52 backbone amide signals induced upon titration with oligonucleotides. Error bars represent the error of the fit for most perturbed residues (n = 10). (D, E) Equilibrium binding between the LEDGF/p52 or p75 splice variants and unmodified, di- or trimethylated nucleosomes, respectively, determined using microscale thermophoresis (MST). Error bars represent the standard deviation from the mean values obtained from n = 3 experiments. (F) Equilibrium binding between the full length LEDGF/p75 splice variant and di- or trimethylated nucleosomes reconstituted with 147 or 166 bp DNA. (G) EMSA showing the effect of the presence of PogZ(1117–1410) on the binding of LEDGF/p75 to di- or trimethylated nucleosomes. Error bars represent the standard deviation from the mean values obtained from n = 3 experiments. (H) Table summarizing the dissociation constants and hill coefficients for figures B-F.

