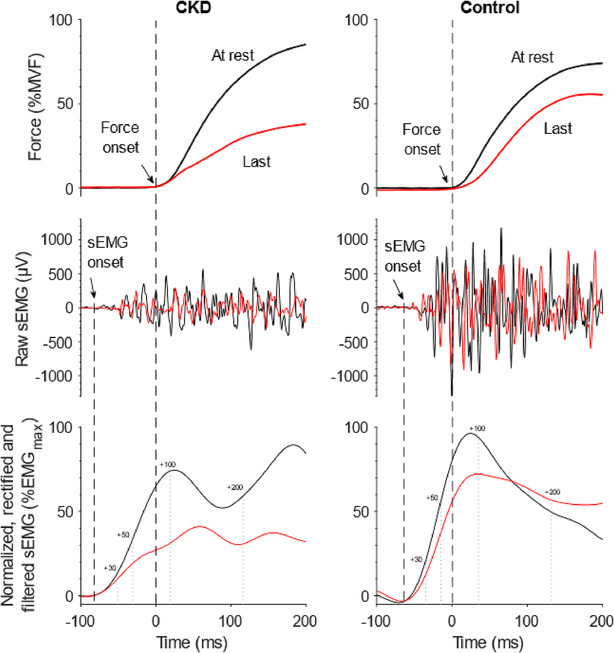
Figure 2.

Experimental traces in PRE (black) and POST exercise (red) of force and surface electromyography (sEMG) signal of representative chronic kidney disease (CKD) and control volunteers. Black dashed lines represent the detection of force and sEMG onset; grey dotted lines represent the time periods considered in sEMG integration (expressed in millisecond from sEMG onset).
