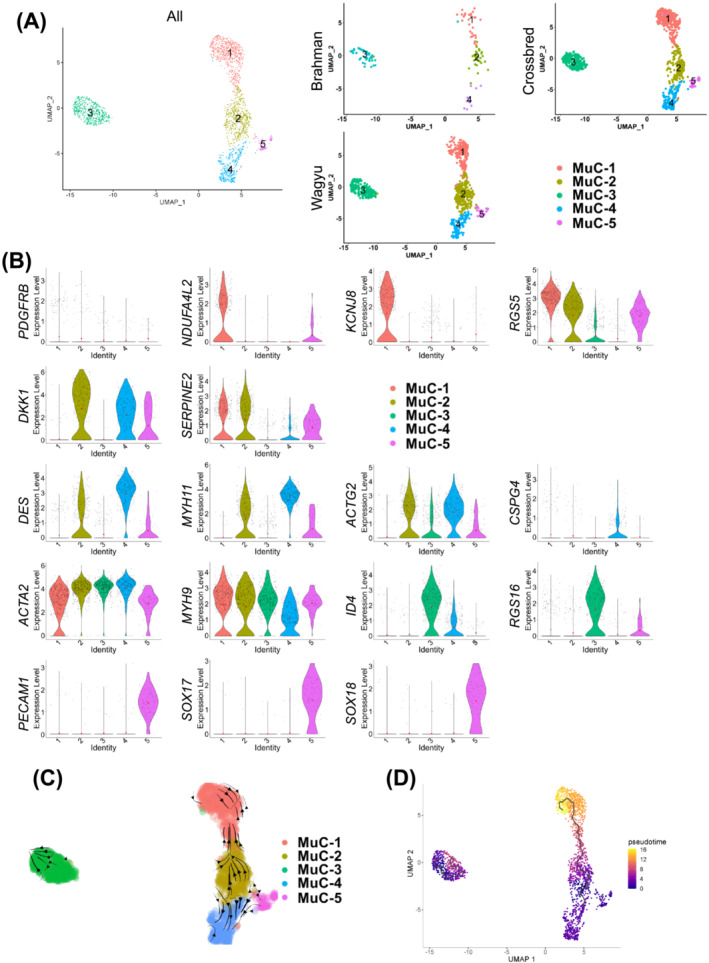
Figure 5.

An analysis of MuCs reveals distinct VSMC and pericyte populations. (A) UMAP graphs show unsupervised clustering of bovine MuCs from all breeds and individual breeds identified by scRNAseq. (B) Feature plots show the expression of select DEGs among different MuC subpopulations. (C) RNA velocity of MuCs. (D) Pseudotime analysis of MuCs.
