Figure 6.

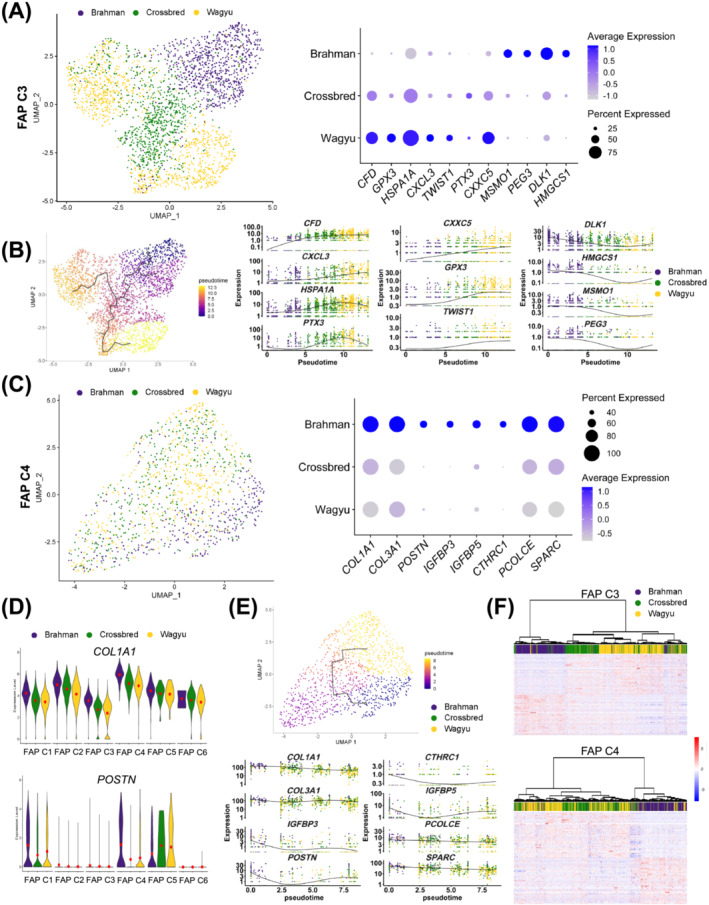
scRNAseq suggests differential activities between Wagyu and Brahman FAPs. (A) A UMAP graph shows bovine FAP C3 from different breeds and a dot plot shows the expression of select DEGs in Wagyu, crossbred, and Brahman FAP C3. (B) Pseudotime analysis of FAP C3 from all breeds and graphs showing the expression of select DEGs along the FAP C3 pseudotime trajectory. (C) A UMAP graph shows bovine FAP C3 from different breeds and a dot plot shows the expression of select DEGs in Wagyu, crossbred, and Brahman FAP C4. (D) Violin plots show the expression of COL1A1 and POSTN in different FAP subpopulations of different breeds. (E) Pseudotime analysis of FAP C4 from all breeds and graphs showing the expression of select DEGs along the FAP C4 pseudotime trajectory. (F) Heatmaps with dendrograms show the expression of the top 50 upregulated genes in Wagyu and Brahman FAP C3 or C4 in Wagyu, Brahman, and crossbred C3 or C4. Individual cells were clustered and connected based on similarities in gene expression.
