Figure 4.

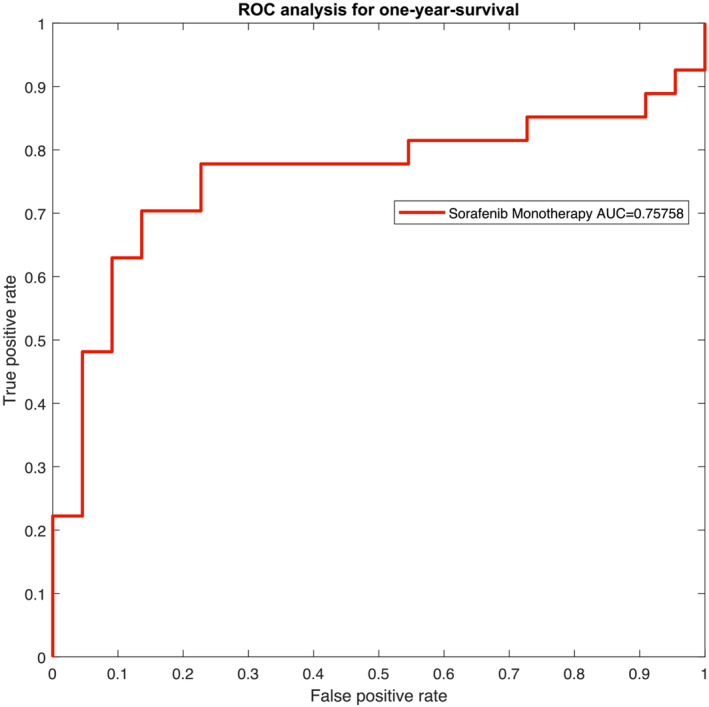
Depiction of the receiver operating characteristic (ROC) curve for Subgroup 1, that is, patients who underwent sorafenib monotherapy. AUC, area under the curve.

Depiction of the receiver operating characteristic (ROC) curve for Subgroup 1, that is, patients who underwent sorafenib monotherapy. AUC, area under the curve.