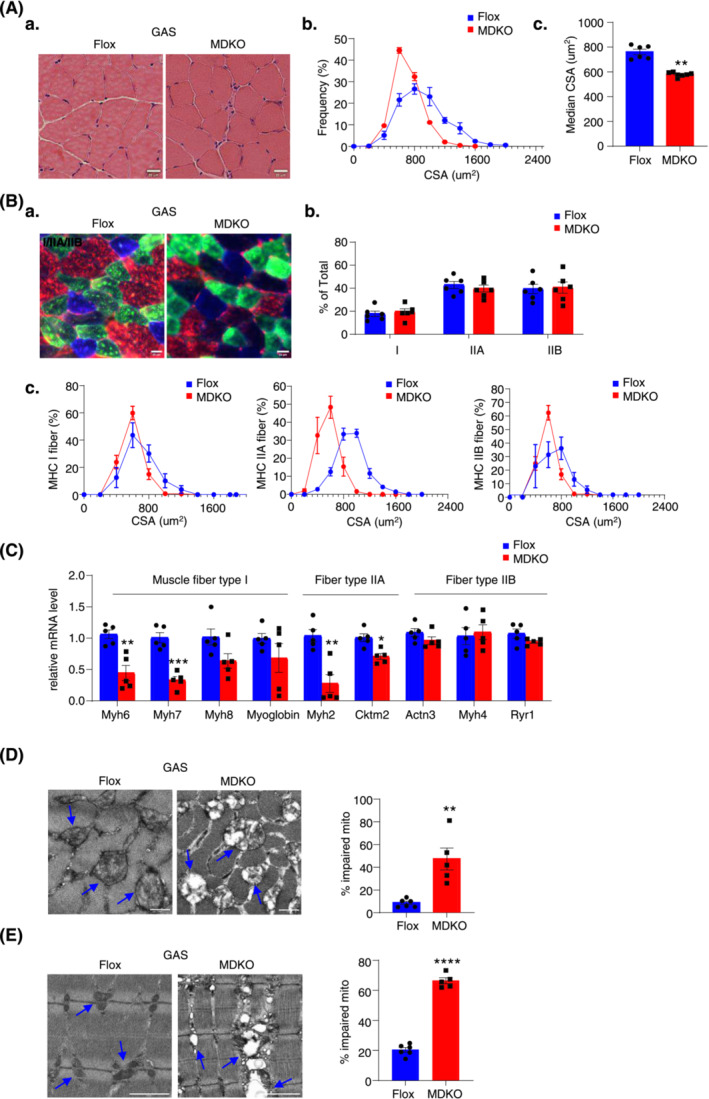
Figure 3.

DJ‐1 ablation in skeletal muscle decreases fibre cross‐sectional area and impairs mitochondrial function. (A) Physiological consequences of GAS H&E staining in male mice at the age of 18 weeks (scale bars, 20 μm). Representative H&E staining of GAS (A). Fibre cross‐sectional area (CSA) distribution and median CSA in GAS of male mice (n = 6–7) (B, C). (B) Immunofluorescence analysis of fibre type composition in GAS. The different myosin heavy chain isoforms were stained in blue (MyHC‐I), green (MyHC‐IIa) or red (MyHC‐IIb) (scale bars, 20 μm). Representative immunofluorescence staining of GAS (A). The ratio of muscle fibre type (n = 6) (B). Fibre cross‐sectional area (CSA) distribution in different muscle fibres (n = 6) (C). (C) Expression of muscle fibre type related genes measured by qPCR (n = 5). (D) Representative electron micrographs of cross and the ratio of impaired mitochondria in GAS of male mice (scale bars, 0.5 μm). (E) Representative electron micrographs and quantification of abnormal mitochondria of longitudinal section. Blue arrows point to the healthy mitochondria in Flox mice and the impaired mitochondria in MDKO mice (scale bars, 0.5 μm). Data represented the mean ± SEM. *P < 0.05, **P < 0.01, ***P < 0.001, a two‐tailed Student's t‐test was used for statistical analysis.
