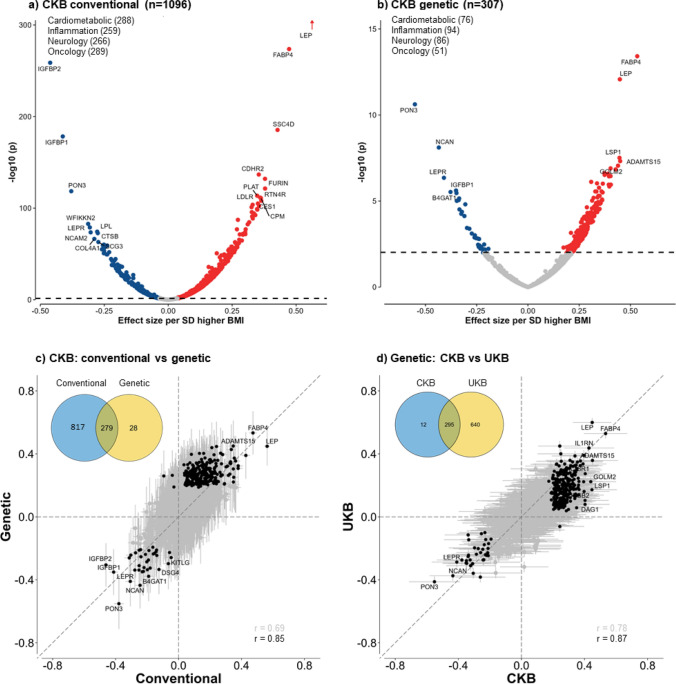
Fig. 2.
Associations of 1-SD higher BMI with 1463 proteins in conventional and genetic analyses in CKB and comparisons of genetic associations between CKB and UKB. Analyses were adjusted for age, age square, sex, study area, fasting time, ambient temperature, ascertainment status, plate ID, and the first 12 PCs (for genetic analyses only). The dotted lines in a and b indicate multi-testing adjusted threshold for statistical significance with red dots showing significant positive associations and blue dots showing significant inverse associations, with names given for certain selected proteins. The solid black dots in c and d are proteins significantly associated with BMI in both conventional and genetic analyses in CKB (left panel) or in both CKB and UKB (right panel), with names given for certain selected proteins

